


The cost of Brexit, ten years on: The impact of leaving the customs union and single market on UK trade
A new CER modelling exercise shows that Brexit has substantially reduced the UK’s trade with the EU, both in goods and services. We find that a customs union with the EU would do little to recover those losses.
A decade after the British public voted to leave the EU in the 2016 referendum, the debate about Britain’s relationship with the bloc is shifting gears.
After many years of keeping quiet about the costs of Brexit, British politicians on the centre-left have become more vocal. Prime Minister Keir Starmer has said that Brexit did “deep damage to our economy” and that his Labour government will be “defined by rebuilding our relationship with Europe”. Chancellor Rachel Reeves has described better trading relations with the EU as “the biggest prize” for reviving economic growth and argued that Britain should align with EU rules when doing so brings economic benefits.
After many years of keeping quiet about the costs of Brexit, British politicians on the centre-left have become more vocal.
A renewed focus on the UK’s relationship with the EU will be an important part of the British political debate in the years ahead. Wes Streeting, the former health secretary who resigned to challenge Keir Starmer for the Labour leadership, said that he wanted Britain to rejoin the EU “one day” – a view shared by Andy Burnham, the main other challenger, who said, “I hope it happens in my lifetime”. Zack Polanski, the Green Party leader, has called for a referendum on rejoining in the future and a customs union “as soon as possible”. The Liberal Democrats have also emphasised their position, which is the same as the Greens: a customs union first, rejoin later.
Discussions about what a much closer relationship with the EU would look like – be it a customs union, rejoining the single market in goods, or the single market in full – are happening behind closed doors. What is missing from these discussions, however, is a clearer understanding of the economic gains that each option might bring, and the political costs that each would entail. Without it, British politicians risk repeating one of the central mistakes of the Brexit era: pursuing options that are either unavailable on the terms they envisage, or those that appear within reach but are unlikely to contribute meaningfully to economic growth.
A customs union appeals to some British politicians because the EU may not insist on the free movement of people as a condition. It would require the UK to apply the EU’s common external tariff to imports from outside the bloc, eliminating the costly ‘rules of origin’ requirements that currently apply when UK-EU goods trade contains too much third-country content. And depending on the form of a customs agreement, it would likely constrain the UK’s ability to set its own trade policy with non-EU countries, including China and the US. A decade on from 2016, the ability to protect one’s market from coercive pressures is becoming more important, and UK-EU customs union negotiations would be particularly thorny on Westminster’s powers to deviate from the EU’s decisions on trade defence.
A customs union appeals to some British politicians because the EU may not insist on the free movement of people as a condition.
Anything beyond a customs union – participation in the EU’s single market for goods, or the single market in full – would allow goods, people, or services to move with fewer border checks, but would involve political trade-offs. These options would require accepting free movement of people, aligning with EU rules without a vote on them, and making substantial financial contributions to the EU budget. These are unavoidable political choices: any British politician wishing to move substantially closer to the EU will need to confront them.
Clear evidence about the economic gains associated with different options can help inform these choices. With that in mind, we analysed the impact of Brexit on goods and services trade, using a new ‘structural gravity’ model. Our aim was two-fold: first, to quantify the trade losses from leaving the EU, and second, to estimate how much of those losses stem from leaving the single market, as opposed to the customs union. Separating the two effects is difficult because the single market and the customs union operate in tandem within the EU. However, we developed a new method that allows us to produce a reasonable estimate of each. The full method is explained in detail in the technical annex.
The trade costs of Brexit
We find that leaving the EU has resulted in large trade losses in both goods and services. We also find that the UK’s decision to leave the customs union accounts for only a small fraction of those losses – which means that negotiating a new customs union with the EU would do little to recover the costs of Brexit. The overwhelming majority of the costs comes from leaving the single market.
There are three main findings from our analysis.
1. Brexit has substantially reduced UK trade with the EU in both goods and services, and on both exports and imports.
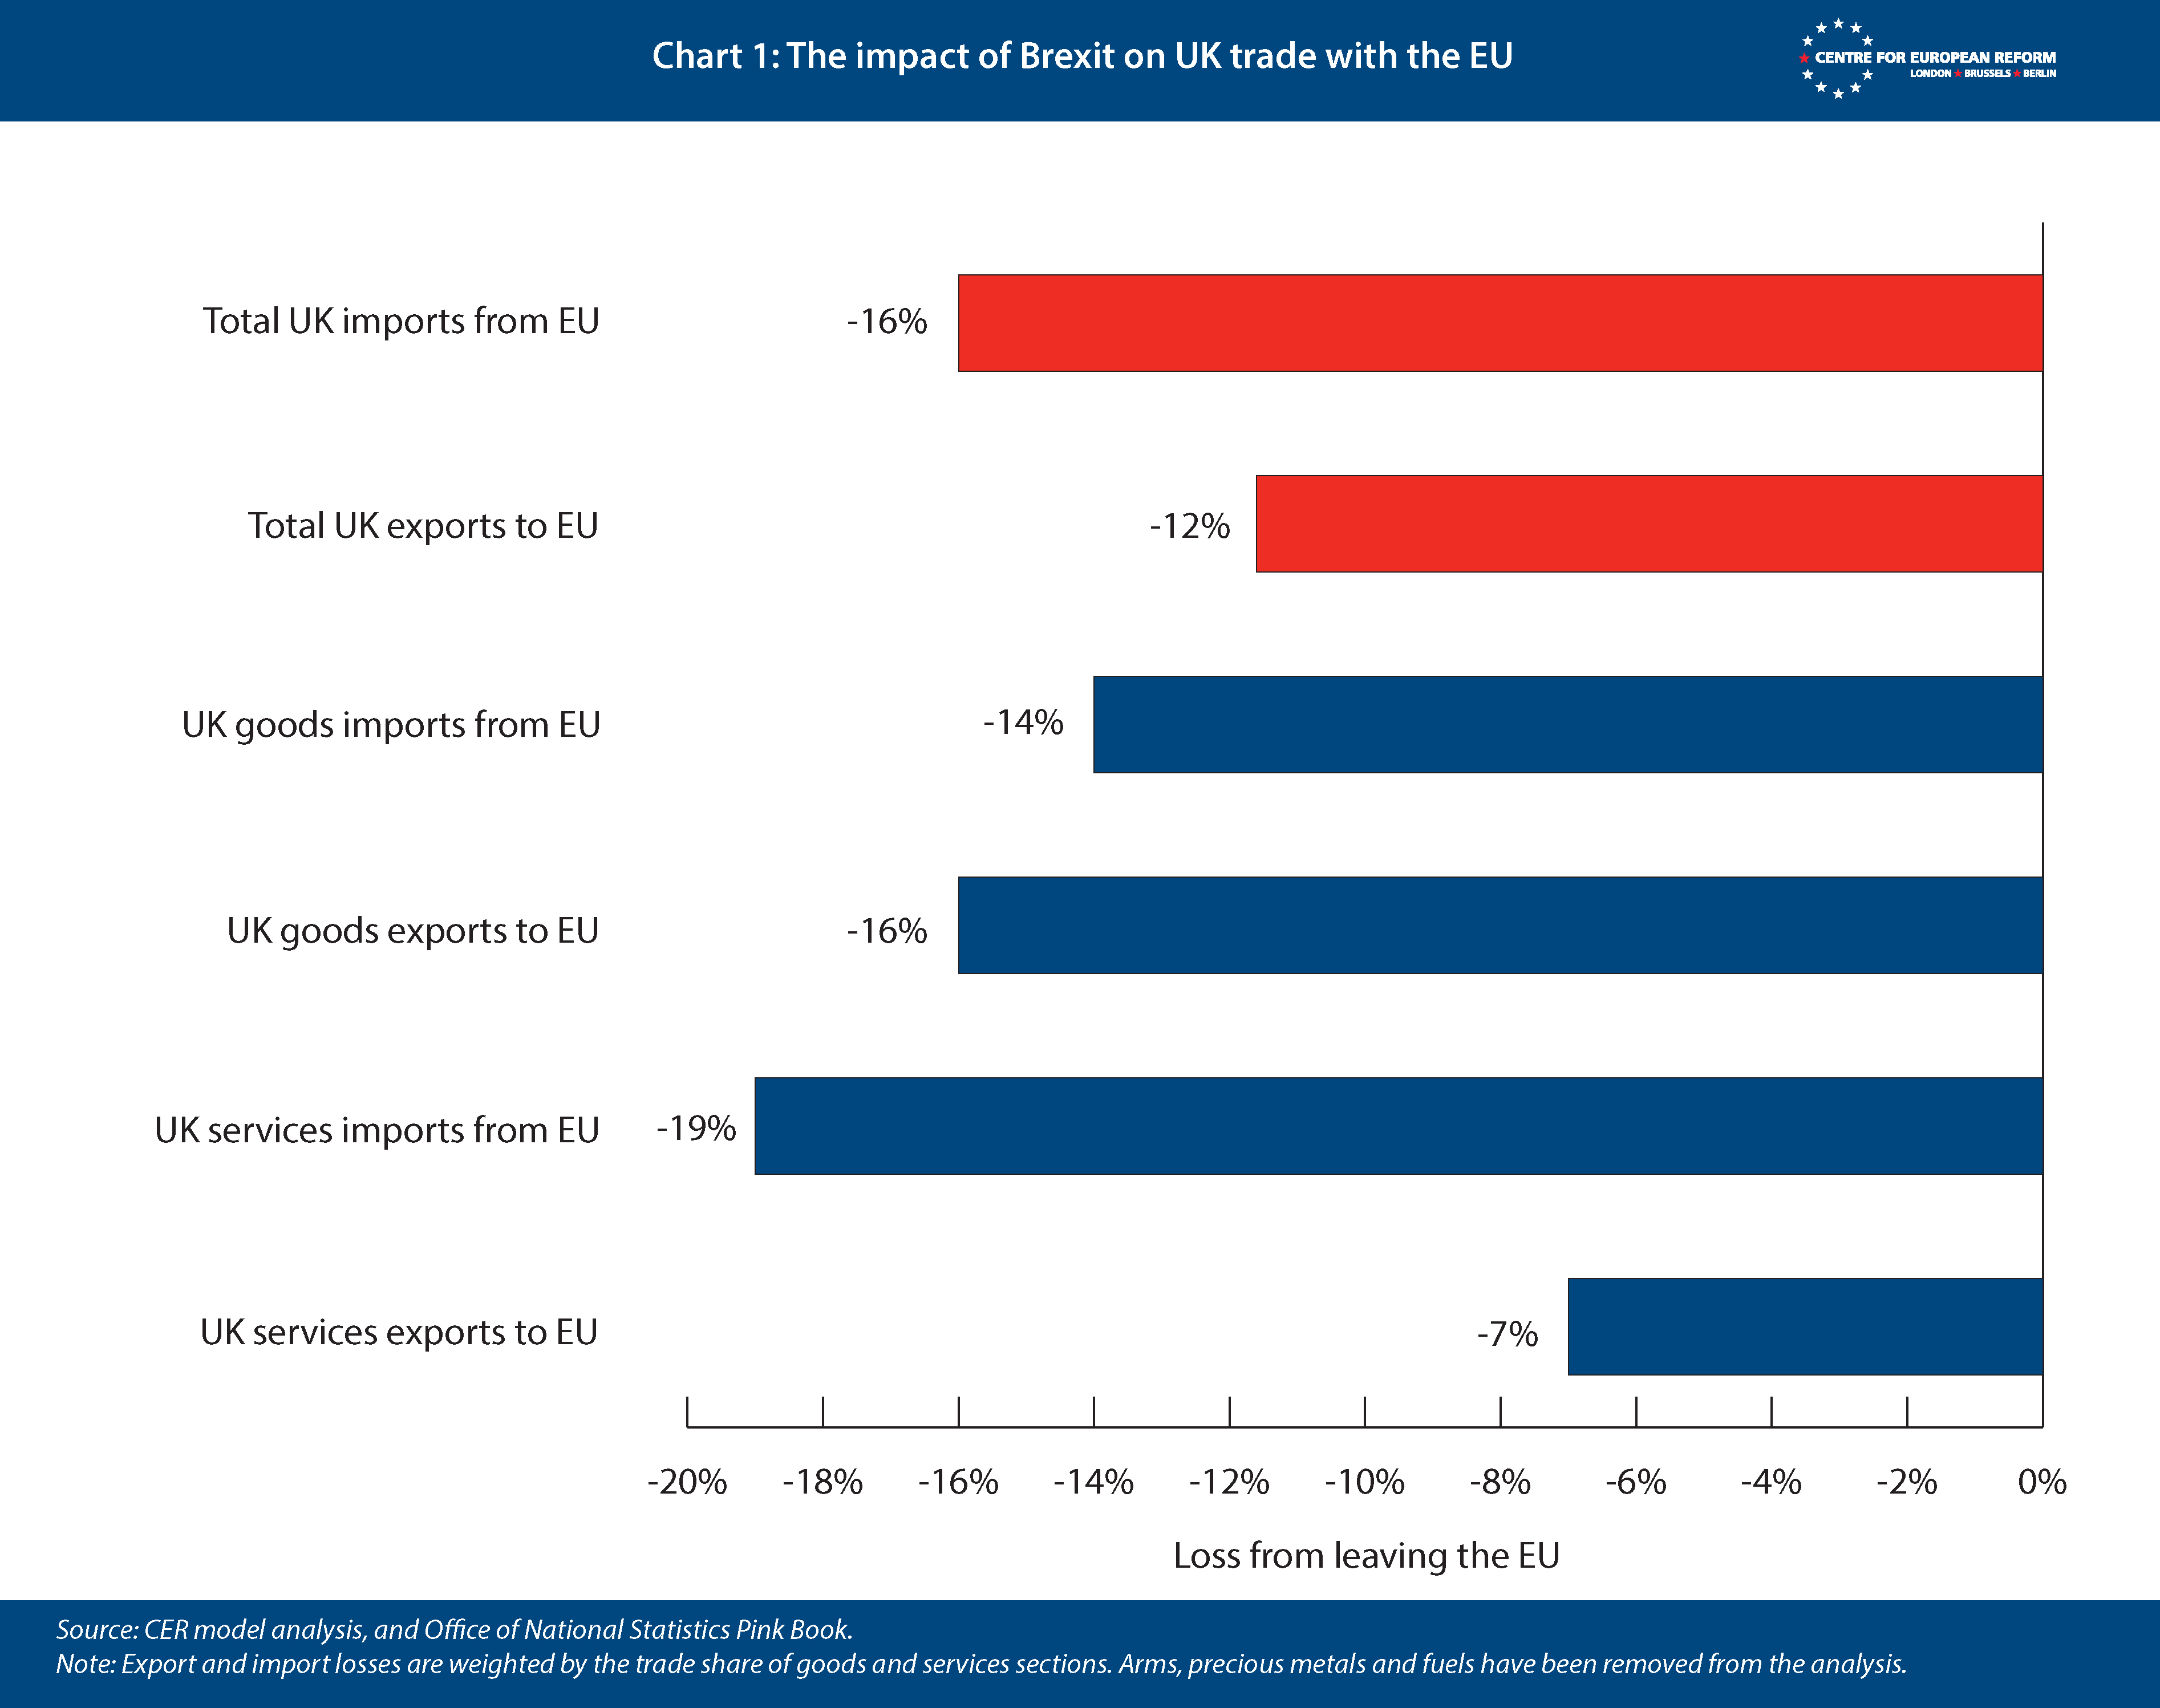
The hit to trade from leaving the EU has been large (Chart 1). Overall, we find that Brexit has reduced total UK exports to the EU by about 12 per cent and total imports from the EU by about 16 per cent. Trade is an important driver of productivity, and these losses reduce UK national income by curbing export sales, making imports scarcer, and reducing the competitive pressure that drives productivity growth.
Goods exports to the EU are about 16 per cent lower than what they would have been had the UK remained a member. Goods imports are 14 per cent lower. The losses are also substantial in the services sectors: services exports to the EU are down 7 per cent, while services imports from the EU are down 19 per cent.
The estimated losses to services trade may seem surprising, since UK services trade has grown at a decent clip since 2019. Global services trade surged during and after the pandemic – and the UK’s comparative advantage in tradable services positioned it well to benefit from that surge. But our analysis suggests it would have grown even more strongly had the UK remained in the single market. This result is similar to recent studies that found that the services sectors most exposed to Brexit barriers saw a significant reduction in exports to the EU.
However, our estimated losses are larger than other studies conducted by comparing UK trends in trade with the EU and the rest of the world over the Brexit period. Exports and imports to the EU have broadly tracked those to the rest of the world, despite new trade barriers being imposed on the EU but not everywhere else. However, this method misses an important part of the story because it does not take into account the growth of trade within the EU since Brexit. Trade flows within the EU rose between 2022 and 2024, as consumers spent their lockdown savings and businesses upgraded their machinery and equipment. Our key assumption is that, had the UK remained a member, its trade with the bloc would also have benefitted from this increase in intra-EU demand.
Overall, these losses amount to a reduction in Britain’s world-wide exports of 5 per cent and imports of 8 per cent. Studies that use synthetic control methods to construct a UK ‘doppelgänger’ find larger trade effects in goods – losses of 10-15 per cent of total imports and exports – but nothing significant in services. These studies estimate trade losses by comparing UK trade performance after Brexit with a weighted control, composed of countries whose pre-Brexit trends were most similar before the UK left. Because they include all factors that have reduced trade – including the drag on UK GDP from lower investment after the 2016 referendum – a smaller economy means lower trade values even if Britain’s trade-GDP ratio is unchanged. Our analysis focuses specifically on the trade costs of higher barriers from leaving the single market and customs union, and identifies smaller effects in goods and larger ones in services. Both approaches are consistent with the estimates that leaving the EU has reduced UK GDP by between 4 per cent, 5 per cent and 6-8 per cent.
Overall, these losses amount to a reduction in Britain’s world-wide exports of 5 per cent and imports of 8 per cent.
2. Leaving the single market has done more damage than leaving the customs union
The second part of our analysis separates the Brexit-related effects of leaving the single market from those of leaving the customs union. The Trade and Co-operation Agreement (TCA), which has governed the post-Brexit trade relationship between the UK and the EU since January 2021, is a ‘zero-tariff, zero-quota’ deal for goods – but that does not mean no tariffs are paid on UK-EU trade in the day-to-day reality. Tariffs are still levied on goods that fail to meet ‘rules of origin’ requirements: the criteria that determine whether goods contain enough UK or EU content to qualify for zero-tariff treatment under the TCA. A customs union would eliminate these costs. But they sit alongside much larger non-tariff barriers – diverging regulatory standards, different product certification rules, border checks, and new restrictions on services trade – which only re-entering the single market would address.
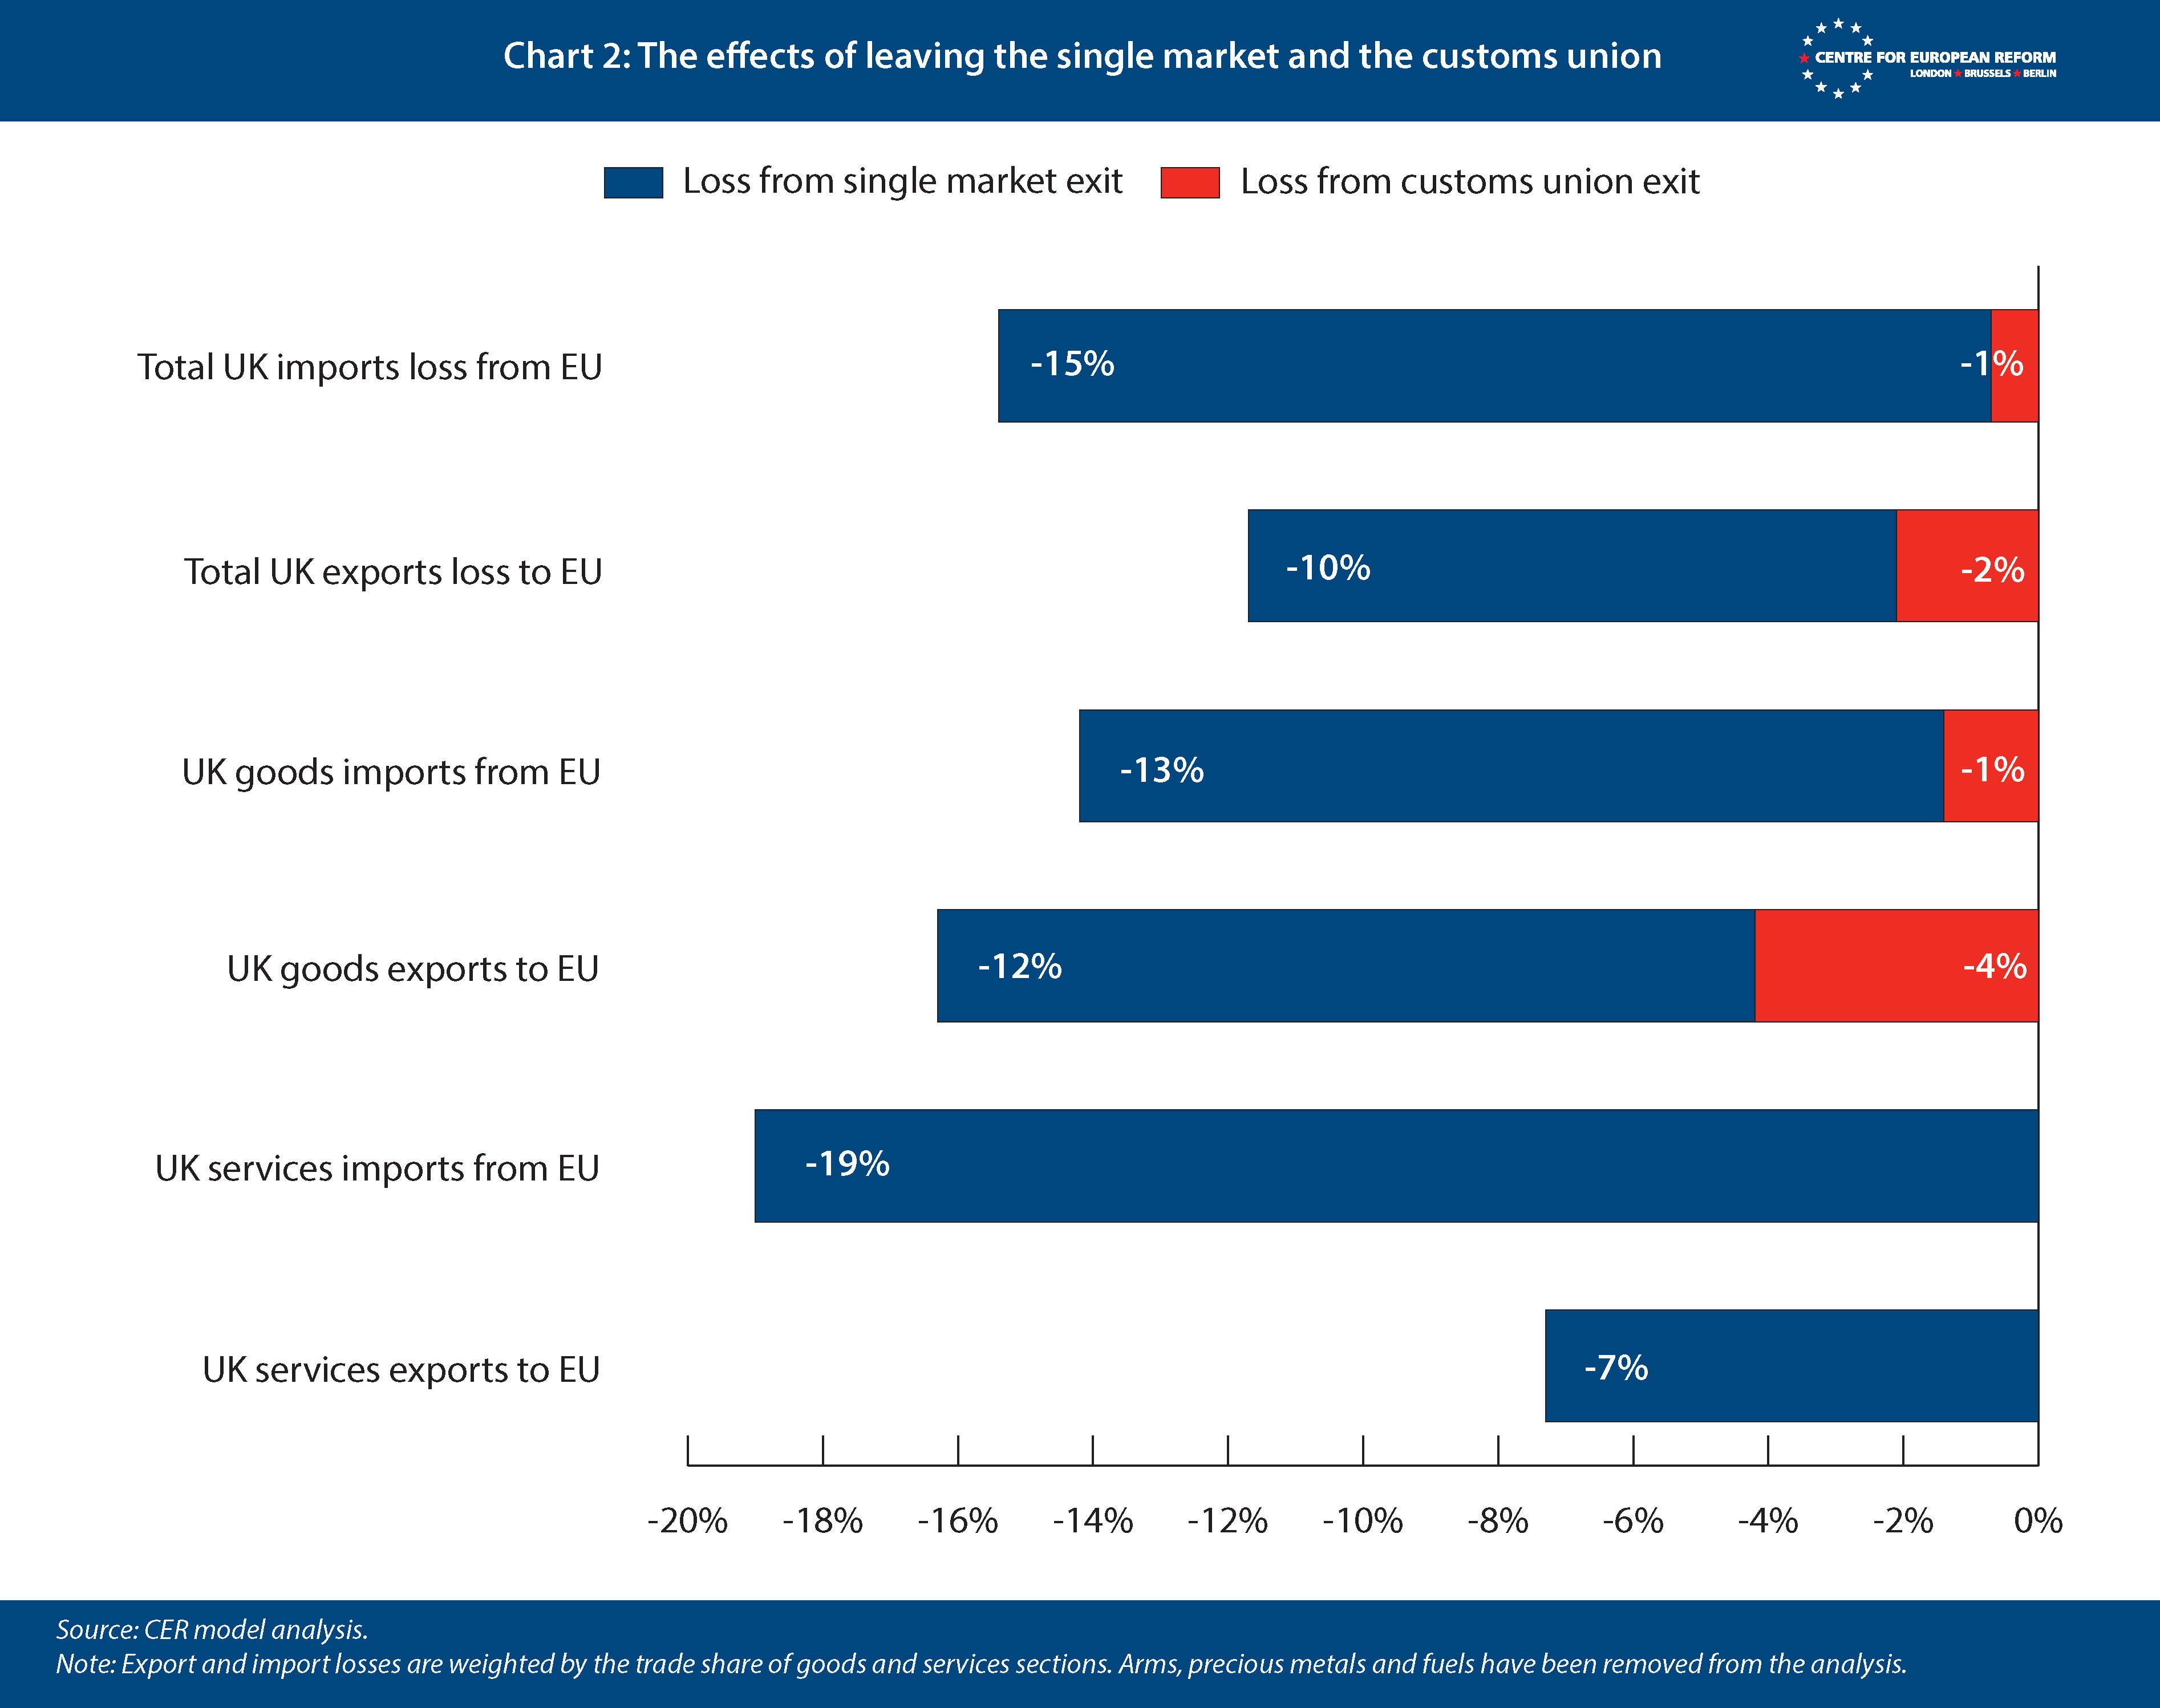
The costs of leaving the customs union, which affect trade in goods, were smaller than those of the single market. Across all goods trade, leaving the customs union reduced UK exports to the EU by about 4 per cent and UK imports from the EU by 1 per cent (Chart 2). This suggests that UK exporters to the EU have faced considerably higher customs-related barriers than EU exporters to the UK. This can be for a variety of reasons: the British government has repeatedly postponed and minimised border controls to keep imports flowing, and UK exporters have made less use of tariff preferences under the TCA than their EU counterparts.
Across all goods trade, leaving the customs union reduced UK exports to the EU by about 4 per cent and UK imports from the EU by 1 per cent.
Taken together, our estimates suggest that the decision to leave the single market accounted for the overwhelming majority of Brexit’s trade impact on UK-EU trade. The regulatory costs related to Brexit – such as new certification procedures and checks for compliance with EU standards – have had a much more significant impact on UK-EU trade than customs-related barriers.
We found little evidence of overall UK trade being diverted to non-EU countries because of new barriers with the EU. Total goods and services imports and exports with the rest of the world changed by less than 1 per cent, controlling for non-Brexit factors that affect trade. However, the sectors in which trade diversion was apparent were often those in which more UK exports fail to meet EU ‘rules of origin’ requirements. This shows that a customs union would be most helpful to UK companies that import goods, add some value, and then re-export them to the EU (and the same for EU companies that sell to the UK). However, only the machinery sector adds a lot of value while doing so.
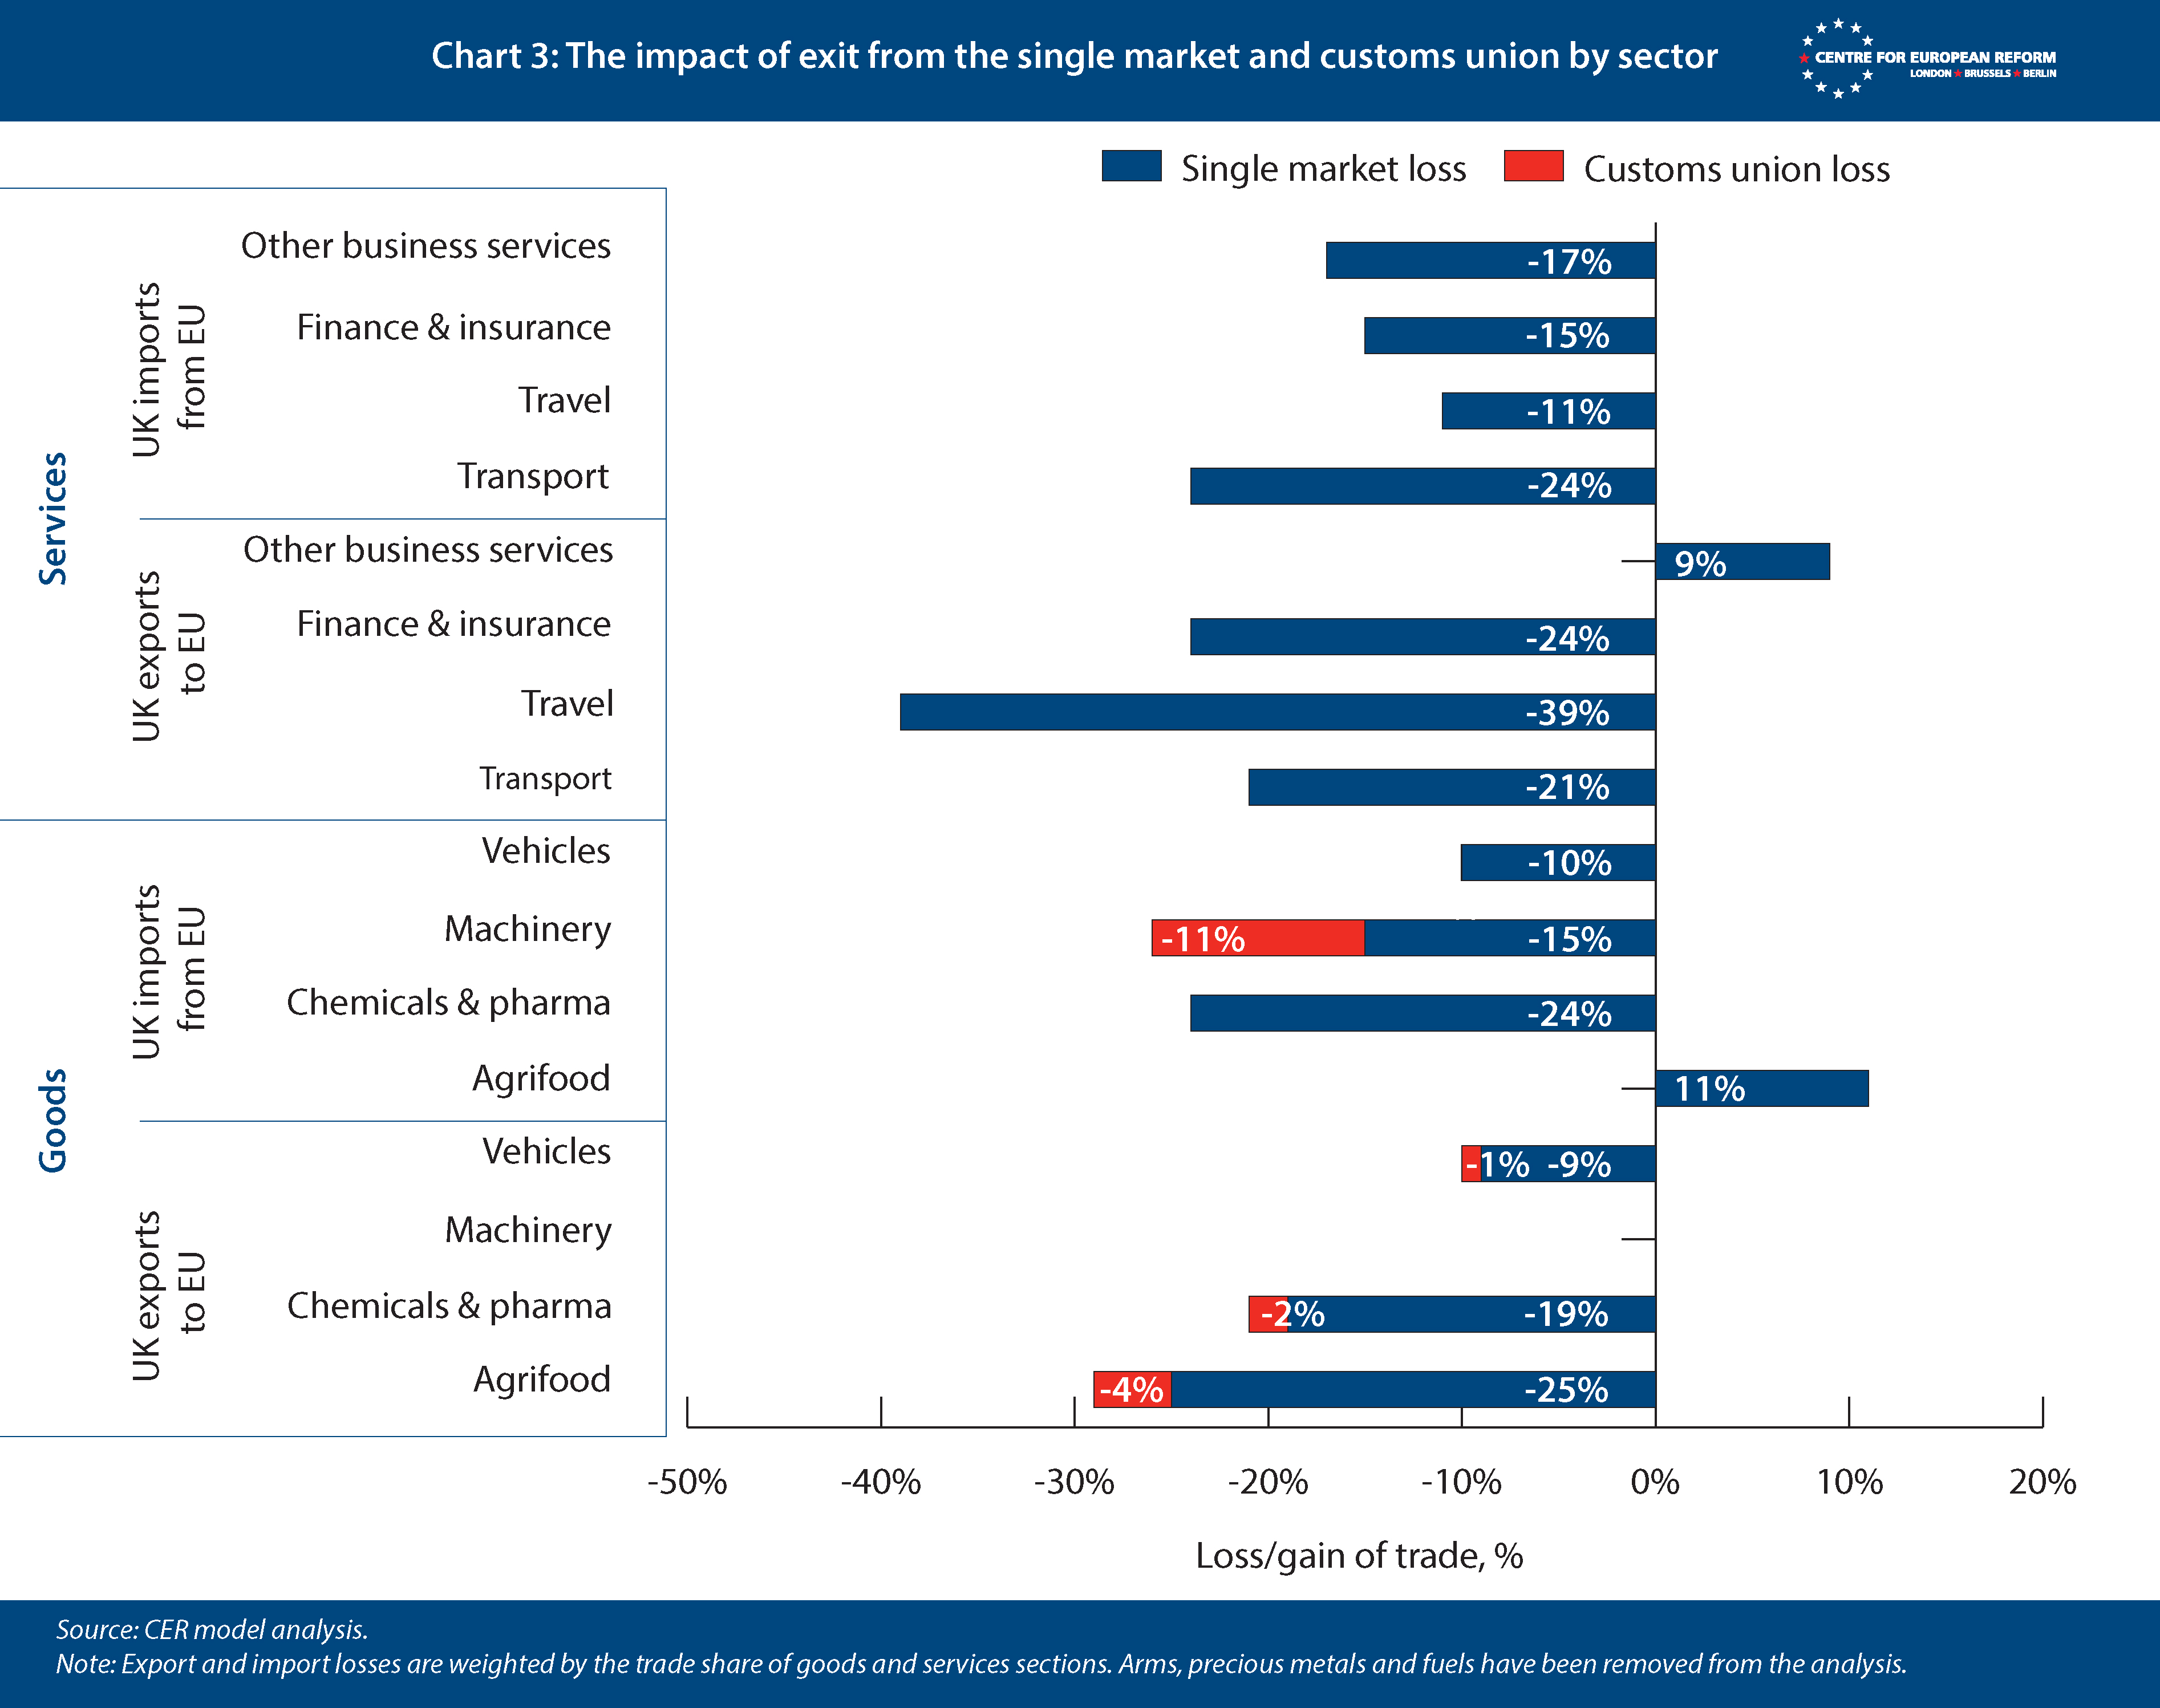
3. Brexit has reduced trade in nearly every sector of the UK economy
This decline in UK-EU trade is visible across most goods and services sectors (Chart 3). Among goods imports from the EU, the largest estimated losses have been in chemicals and pharmaceuticals, down about 24 per cent, and in machinery, down 26 per cent. Vehicles are down 10 per cent. Agrifood is the main exception, where imports from the EU have increased, potentially reflecting the decisions by successive British governments not to impose border checks on food imported from the EU.
Among goods exports to the EU, the losses are led by agrifood, down 29 per cent, and chemicals and pharmaceuticals, down 21 per cent. Britain’s machinery exports, by contrast, have not fallen, perhaps reflecting the deep production niches of UK manufacturing, which keeps EU demand strong despite trade barriers raising prices.
The services picture is more mixed. On services exports, the worst affected sectors are travel (down 39 per cent) and transport (down 21 per cent) – reflecting weaker business travel, tourism and logistics. Financial services are down 24 per cent. The only bright spot is ‘other business services’ – a sector that includes law, accountancy, engineering and scientific research – which has grown by nearly 9 per cent relative to the counterfactual. These are the sectors where the UK has strengths that have been largely independent of EU membership.
All these patterns are consistent with other cross-sector studies of goods and services. The UK’s economy has become substantially less open since Brexit. And according to our analysis, the primary reason, across almost every sector, is the decision to leave the single market.
The effect of leaving the customs union varies considerably across sectors (see Chart 3). It is largest in machinery, where it accounts for around half of the losses in imports. This reflects the fact that manufacturers in this sector rely heavily on imported components from outside the UK and the EU. The customs union impacts are also relatively significant in wood products, textiles, footwear and prepared food. In most other sectors – including chemicals and pharmaceuticals, and vehicles – the customs union effect is small, with the single market accounting for nearly all of the loss.
The muted customs union effect on the car industry is surprising. One possible explanation is that larger manufacturers faced significant one-off adjustment costs in restructuring their supply chains after Brexit, but having done so are better placed than smaller firms to absorb the ongoing cost of compliance with ‘rules of origin’.
The policy choices
This new evidence shows that Brexit has had a substantial impact on the UK’s trade with the EU. By making the British economy less open, it has contributed to sizeable GDP losses identified by several other studies. But our findings suggest that the economic gains from a closer relationship with the EU would vary considerably, depending on the policy pursued.
This new evidence shows that Brexit has had a substantial impact on the UK’s trade with the EU.
The current ‘reset’: Worthwhile but limited
The UK-EU reset currently underway is focused on a set of targeted agreements: a ‘sanitary and phytosanitary agreement’ (SPS) covering agrifood trade, linking of the UK and EU emissions trading systems, the UK’s re-entry into the internal electricity market, and a youth mobility scheme. These are worthwhile measures and, in the case of both the SPS agreement and energy trade, would address genuine frictions experienced by businesses.
Our findings suggest that agrifood exports to the EU have fallen by 29 per cent since Brexit – the largest loss of any goods export sector. An SPS agreement, by reducing the border checks and regulatory divergence that currently impede agrifood trade, could recover a meaningful share of that loss. However, agrifood is a relatively small share of overall UK-EU trade, accounting for around 10 per cent of UK goods exports to the EU and 18 per cent of goods imports. The reset, even if fully implemented, would leave the vast majority of Brexit’s trade losses unaddressed.
A customs union: Limited gains, large constraints
A new customs union with the EU is often presented as a politically viable middle ground. It would remove some of the practical barriers to trade with the EU, including ‘rules of origin’ requirements, without requiring the free movement of people. But our analysis suggests that the economic case for a customs union is weaker than its proponents imply.
Across all goods trade, leaving the customs union accounts for only around 7 per cent of the losses in imports and 25 per cent of the losses in exports. The gains would be concentrated in a small number of sectors – particularly machinery – where leaving the customs union accounts for roughly half of the import losses, and to a lesser extent wood products, textiles, footwear and prepared food. But in most sectors, the majority of the economic damage stems from leaving the single market, rather than the customs union, which is far from offering an easy way out of Britain’s predicament.
Across all goods trade, leaving the customs union accounts for only around 7 per cent of the losses in imports and 25 per cent of the losses in exports.
A customs union would also come with constraints: the UK would need to apply the EU’s common external tariff, limiting its ability to pursue an independent trade policy in goods with non-EU countries, including the US and China. These constraints matter more than they did during the pre-2020 Brexit debate, because trade policy has become increasingly entangled with economic security and geopolitics. Depending on the terms of any agreement, a customs union with the EU today would probably involve aligning with EU trade-defence measures, and limit the UK’s ability to respond independently to global trade pressures and wider geopolitical risks. Whether those constraints are worth the modest economic gains is a political judgement, but one with major implications for the UK’s future ability to respond to significant new risks that are bound to grow in today’s world.
The single market: Large gains, hard choices
The overwhelming majority of the estimated trade impacts stem from leaving the single market. Recovering those losses would entail re-integrating with the EU economy via a single market, either in goods or in full, through a bespoke arrangement or eventual EU membership.
Either path involves difficult political choices: accepting free movement, making budget contributions, and aligning with EU rules without a vote on them. The more privileged the single market access sought by the UK, the greater the obligations it would be expected to accept.
There is no straightforward route to meaningful single-market participation without political costs. Even the closest available precedent – a relationship modelled loosely on the EU’s recent agreements with Switzerland, which comes close to full integration in the single market for goods but not services – would require continuing regulatory alignment, free movement of people and ongoing financial contributions to the EU.
The political options for bringing the UK closer to the EU exist. None of them is cost-free. But, as our analysis shows, nor is the status quo.
Technical appendix
The objective of this study is to provide an up-to-date estimate of the impact of Brexit on UK-EU trade and to separate out the effects of leaving the customs union from those of leaving the single market. In doing so, we fitted three ‘structural gravity’ models that allowed us to:
1) assess the impact of Brexit on UK-EU trade across goods and services sectors;
2) estimate the average difference between EU-EU flows and EU-FTA partner flows across goods sectors;
3) assign customs union and single market effects to that difference.
The third model allows us to identify how much of the overall goods trade losses (Model 1) is down to leaving the customs union – the remainder is down to leaving the single market.
Model 1: The overall trade impact
We used bilateral goods trade data at the Harmonised System (HS) section level, in current US dollars, from CEPII, and World Bank/OECD BaTIS data on services sectors. That data is across all global trade partners for 2004 (in goods, to pick up the integration effects of new EU joiners), 2014-19, and 2022-24. Data for 2020 and 2021 were excluded because of the distorting effects of the Covid pandemic on trade flows. To reduce computing time, we limited the number of countries in the model to those that make up 95 per cent of Europe’s external trade, as well as EU, UK, Switzerland and European Economic Area countries.
This model assesses the impact of Brexit on UK goods and services exports and imports, by sector (vehicles or financial services, for example). It allows us to hold all factors that affect trade constant – geographical distance, recessions in one trade partner, changes in exchange rates, for example – and assess how much more the UK trades with the EU, and EU member-states with themselves – than other trade partners do. The model is estimated using ‘pseudo-poisson maximum likelihood’ (PPML), with separate dummies for UK-EU and EU-12-EU trade flows. We used 12 older EU member-states as the control to assess whether their trade with each other and the newer member-states grew after Brexit (minus Ireland, which was more affected by Brexit than other EU states, and Luxembourg, whose trade data is skewed by multinational tax strategies). We also included dummies for the top-10 non-EU trade partners in each trade sector, to account for trade diversion. We added time-varying importer and exporter and time-invariant country-pair fixed effects, as is standard in the recent literature – these control for distance, fluctuations in GDP, currency moves and other factors that affect trade. Using PPML is also standard in the recent literature.
We then applied a ‘difference-in-differences’ (DiD) framework to the model’s output. We compared the annual UK-EU coefficients and assessed how they changed before Brexit (2014-19) and after (2022-24), using the change in EU-12-EU coefficients over the same period as the control. The DiD is the UK-EU average post-Brexit (2022-24) minus the UK-EU average pre-Brexit (2014-19), minus the EU-12-EU post-Brexit minus the EU-12-EU pre-Brexit. This procedure allows us to account for the fact that intra-EU trade itself has changed over the Brexit period.
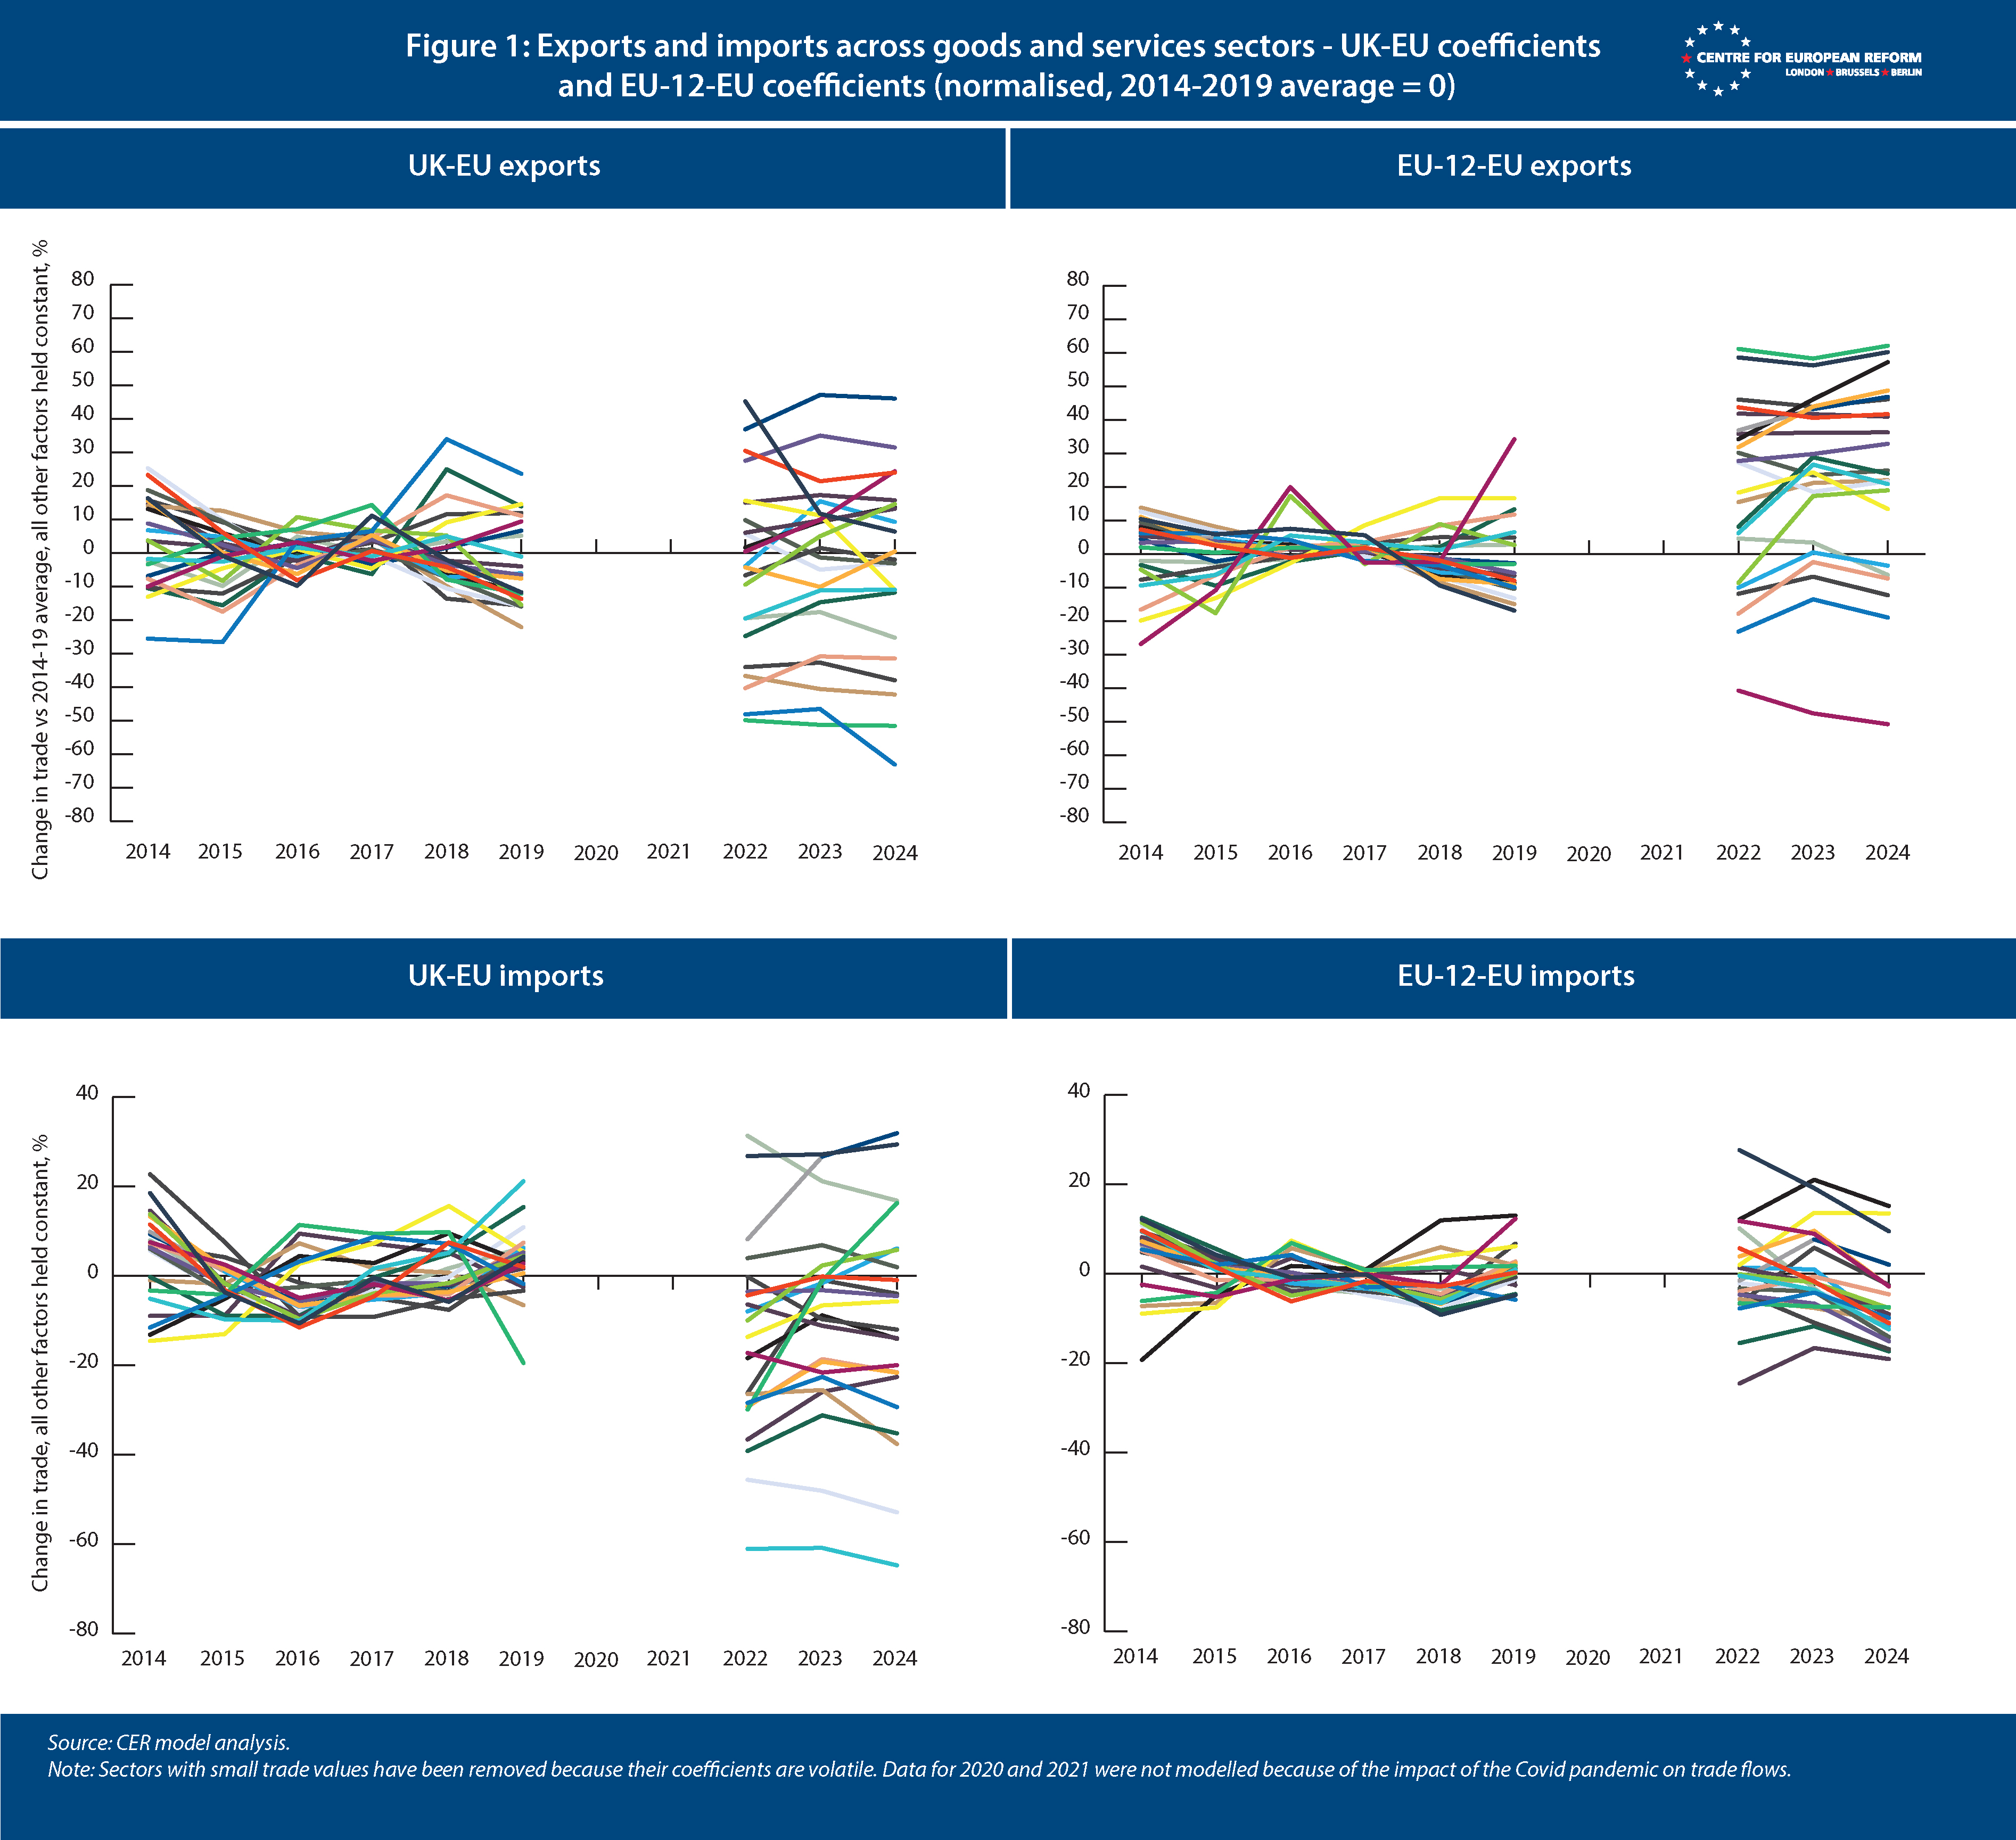
Figure 1 compares the UK-EU coefficients and the EU-12-EU coefficients for goods and services sectors over time, each normalised so that the 2014-19 average = 0. When the UK lines fall, this means that UK trade integration with the EU is going into reverse relative to the pre-Brexit period. When the EU-12 lines rise, trade integration within the EU is increasing. Before Brexit the series move broadly in parallel, consistent with the parallel trends assumption required for DiD to be valid. After Brexit, the majority of UK sectors fall relative to the EU-12, suggesting that leaving the EU is the cause of the loss of trade integration and that the DiD is valid.
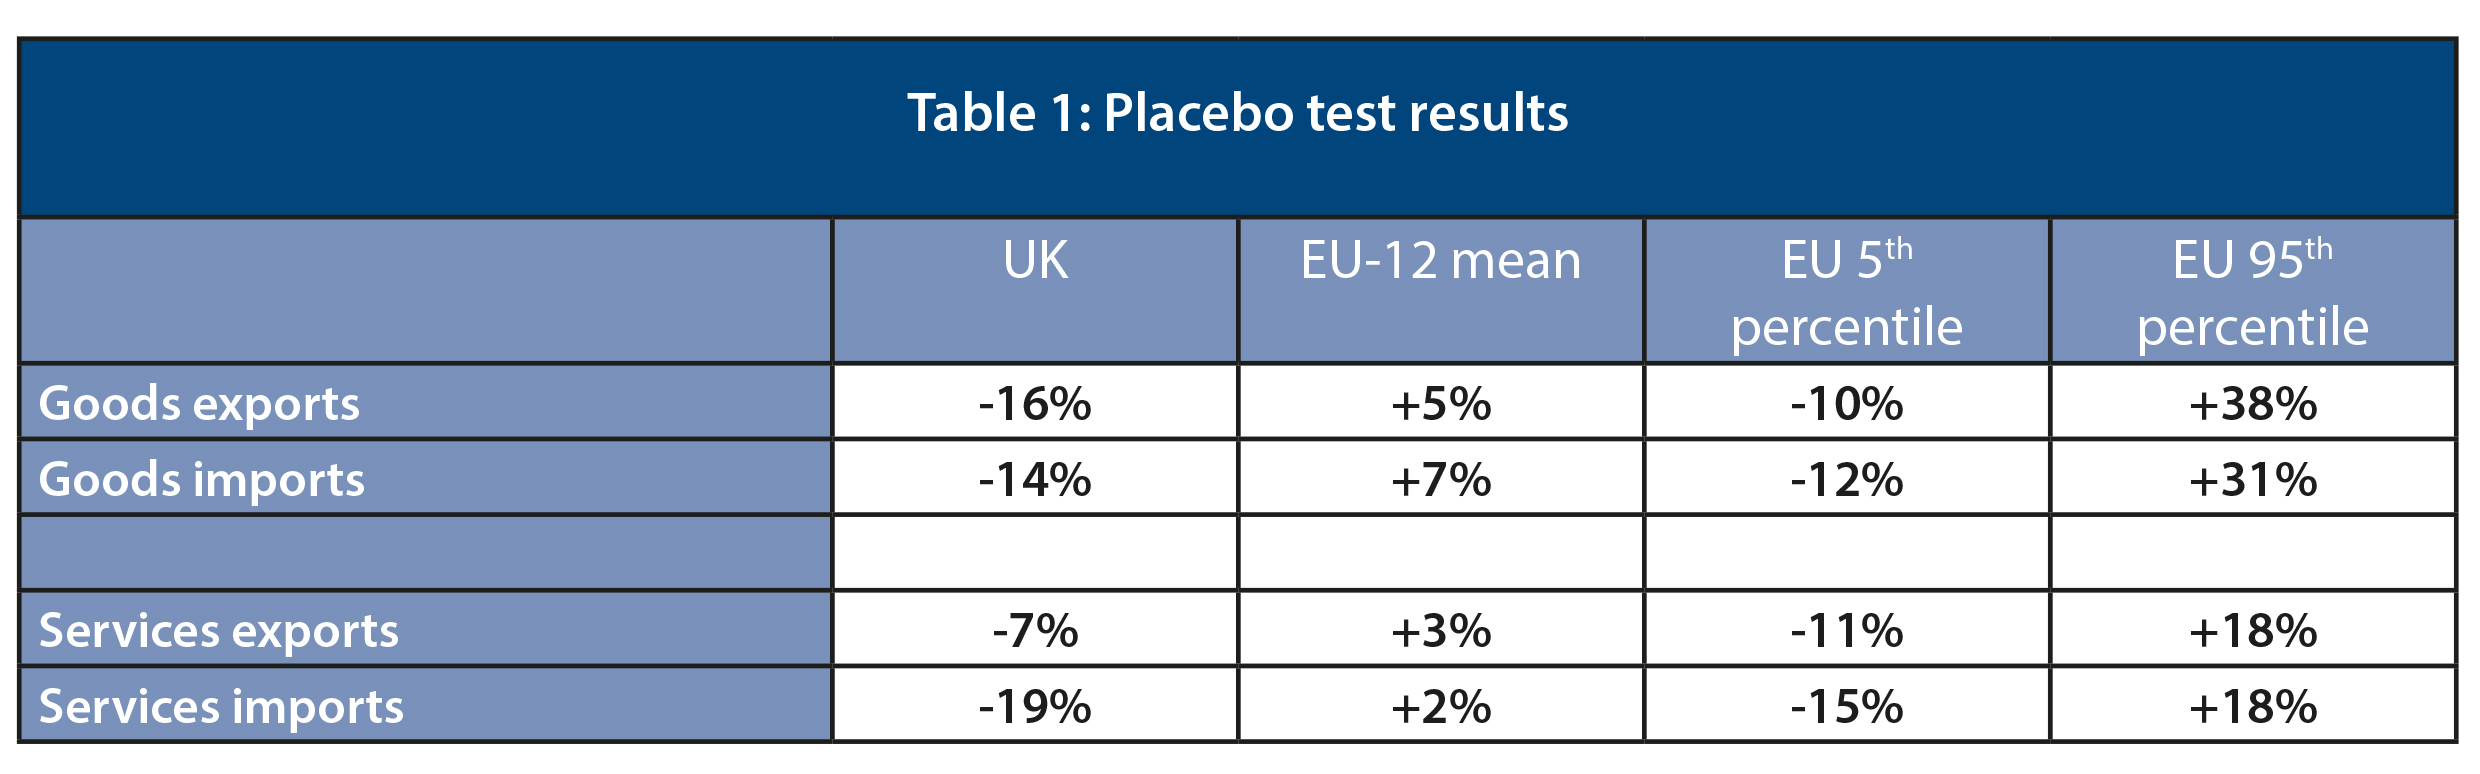
To validate the results, we ran a ‘placebo test’ – so-called because each of the 12 EU member-states is modelled as though it too had been given the ‘treatment’ of leaving the EU. Each of the EU-12 entered the model just as the UK did, with specific coefficients testing whether their trade integration had fallen between the 2022-24 period, compared to 2014-19. The results are shown in Table 1 below. On average, EU-12 trade integration improved somewhat after Brexit, shown by the positive means. The UK falls outside the 5th percentile of worst performance in goods exports, goods imports and services imports – meaning that no other EU-12 country matched the UK’s underperformance across all trade sectors. In services exports, the UK performs better than the 5th percentile, but this may reflect weak tourism revenues in some EU-12 countries in 2022-23, and the strong growth of UK exports in other business services.
Model 2: The EU customs premium
Models 2 and 3 together answer the question: how much of the overall Brexit trade loss is attributable to leaving the customs union, and how much to leaving the single market? Because there is only limited data for effects of customs barriers on the UK’s trade performance since Brexit, we used data for all 27 member-states trade with all of the EU’s 43 FTA partners, including the UK. This allowed us to establish a measure of how much the customs-related costs reduce the EU’s trade with its FTA partners, and then to apply the trade costs of EU-FTA ‘rules of origin’ to the UK, to estimate how much they contribute to the overall goods trade losses.
Model 2 does the first step, which is to establish how much higher EU-EU trade is than EU-FTA trade (and how much EU-FTA trade is higher than the EU’s trade partners that have no FTA). We used the same ‘structural gravity’ approach, but dropped country-pair fixed effects because they were collinear with the EU-EU and EU-FTA flows dummies in this specification. We replaced them with distance, contiguity and common language variables – consistent with the approaches using country-pair effects – and retained importer and exporter fixed effects.
Model 3: The customs union effect
This model zooms in on EU-FTA trade to assess the costs of ‘rules of origin’ – the friction that would be eliminated if the UK were in a full customs union with the EU.
We use the European Commission data on preference utilisation rates (PURs) for EU FTAs, covering 2022-24. PUR data measures the extent to which businesses make use of the tariff preferences provided by trade agreements. The data records the share of bilateral trade with EU FTA partners conducted on a preferential basis and the share conducted on a ‘most favoured nation’ (MFN) basis, for each EU member-state, FTA partner, and goods section.
MFN trade is, in most cases, subject to tariffs – either because goods fail ‘rules of origin’ requirements, importers find compliance costs too onerous, or businesses are simply unaware of the preferential rates available to them. PUR data is not a fine-grained measure of all customs-related costs – it does not, for example, capture customs declarations, physical checks and other administrative barriers. But it provides a comprehensive measure of the trade share affected by ‘rules of origin’ requirements, which is the main driver of the customs union effect we seek to isolate.
We fitted a model on EU-FTA partner trade only, using the same structure as Model 2: importer and exporter fixed effects, plus distance, contiguity and common language variables. The variable of interest is the MFN-treated share of trade with each FTA partner. Where the MFN-treated share is high in a given goods sector – meaning more trade fails ‘rules of origin’ requirements, or traders do not bother to apply preferences – bilateral trade with the EU is lower. The resulting sector-level coefficients give us the trade elasticity with respect to ‘rules of origin’ compliance, as a measure of the customs union effect. We use these elasticities to answer the following question: If no trade flows were treated as MFN – that is, if all trade with that FTA partner passed ‘rules of origin’ tests – how much would trade rise? Applying these coefficients to the UK’s actual MFN-treated share in each goods sector gives us an estimate of how much UK-EU trade would rise if all trade had no tariffs applied – to simulate the UK being outside the single market but inside a customs union with the EU.
The gain from joining the EU is the difference in the coefficients between the EU-EU and EU-FTA trade in Model 2. The share of that gain from joining the EU’s customs union is when MFN trade is zero, per Model 3. The share of the gain from joining the single market is the overall EU gain, less the losses imposed by the goods that failed ‘rules of origin’ requirements and had tariffs applied. These customs union and single market shares are then applied to the overall Brexit losses that we estimated in model 1, with the signs reversed so that they were losses, not gains.
Two final methodological notes to conclude: we attempted to combine Models 2 and 3, with the ‘rules of origin’ data interacted with EU-FTA dummy within a single model. However, because we only have ‘rules of origin’ data for 2022-24, there was insufficient variation to avoid collinearity with the dummy, as the model included, by necessity, prior years of data. It is not ideal to have separate models, but Model 3 is nested perfectly within Model 2 – covering only EU-FTA trade, with the same structure.
Furthermore, within goods sectors, it might be that the UK’s trade with the EU is less affected by MFN treatment than other EU FTA partners. The PUR data is at section level, and UK trade within sections may be skewed towards products in which MFN treatment does not make much difference to trade, or makes a substantial difference. This may bias the results. But across sections the UK’s sector-weighted overall share of trade that is treated as MFN is 18 per cent, and the average share of all the EU’s FTA partners is 22 per cent. By section, the difference between the UK and the average EU FTA partner is large in plastics and rubber, raw hides and leather, wood products and textiles, but similar in the sectors with the largest UK-EU trade values – machinery, vehicles, chemicals, prepared food and base metals. This gives us confidence that the UK is not an outlier on MFN trade among the EU’s FTA partners.
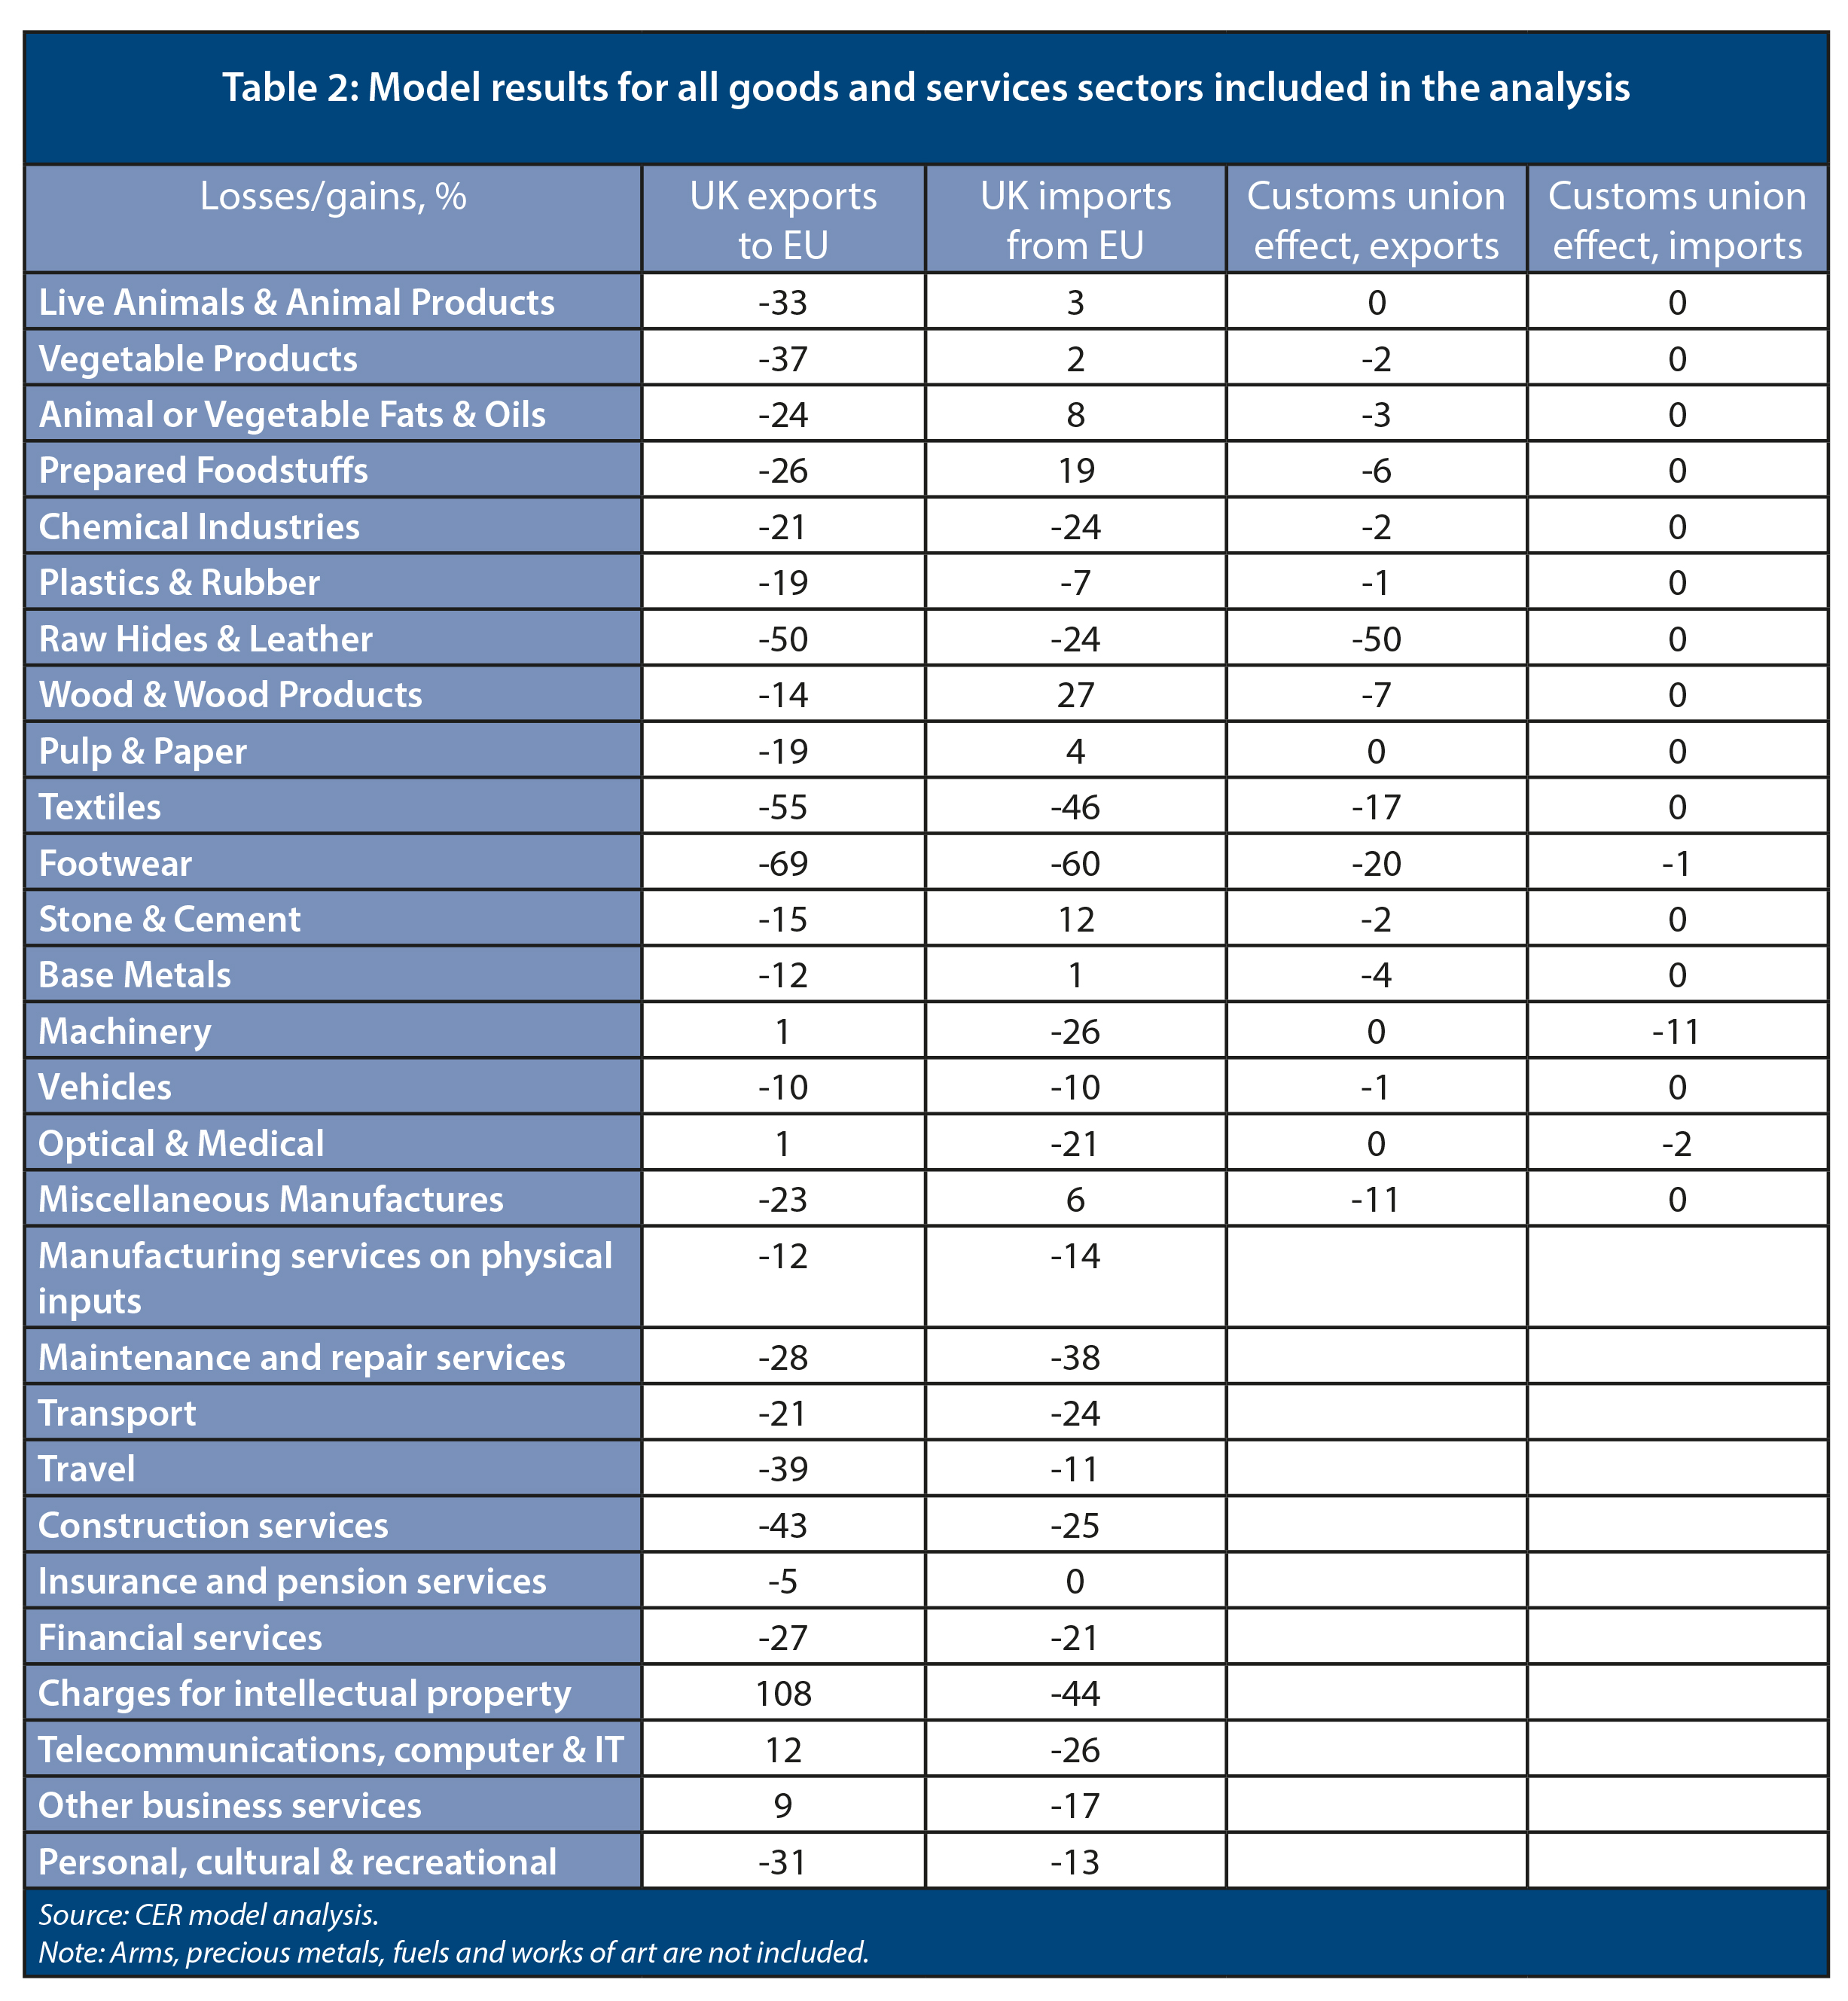
The losses/gains across all goods and services sectors included in the analysis are shown in Table 2.
Contact the authors for access to the datasets and model scripts.
John Springford is a non-resident associate fellow and Anton Spisak is assistant director at the Centre for European Reform.
June 2026
Download full publication
Add new comment