
The cost of Brexit to June 2018
The UK economy is 2.5 per cent smaller than it would be if the UK had voted to remain in the European Union. The latest update of the Centre for European Reform’s calculation of the cost of Brexit in the second quarter of 2018 shows the damage is growing even though the UK has yet to leave the bloc. The knock-on hit to the public finances is now £26 billion – or £250 million a week.
The culprit is the vote for Brexit, as our findings demonstrate. In June 2018, we published our first estimate of the cost of the decision to leave the EU, based upon a modelling exercise, and found that the British economy was 2.1 per cent smaller by the end of the first quarter of 2018. According to our revised model, which uses a broader set of data, the British economy was 2.5 per cent smaller in the second quarter of 2018 than it would have been if the referendum had gone the other way: the cost is growing.
Our original estimate used a model developed by a group of academics who calculated the cost at 1.3 per cent of GDP in the third quarter of 2017. We have updated their method to take into account helpful feedback from various experts on our June estimate. We made the original model specifications and data available to everyone to ensure any gremlins, which are inevitable when conducting modelling exercises, were ironed out. Interested readers can turn to the appendix below, which explains how our revised model works.
The basic aim of the CER’s cost of Brexit model is simple: to compare the ‘real’ UK to a UK that did not vote to leave the EU. We use data from other advanced economies to create a ‘synthetic’ UK that did not vote to leave the EU. To do this, we use a computer program to select – from a group of 22 advanced economies – those countries whose economic characteristics closely match the UK in the run-up to the Brexit referendum. It then combines them to form a doppelgänger UK. The program continues to chart how the UK doppelgänger did after the referendum – and we can then compare its performance to the real UK data.
The CER’s synthetic UK is constructed using quarterly real GDP data and other economic indicators from the 22 advanced economies starting in the first quarter of 2009. The countries the program has selected include the US (whose growth rate makes up 50 per cent of that of the UK doppelgänger), Germany (28 per cent), Luxembourg (11 per cent), Iceland (10 per cent) and Greece (2 per cent).
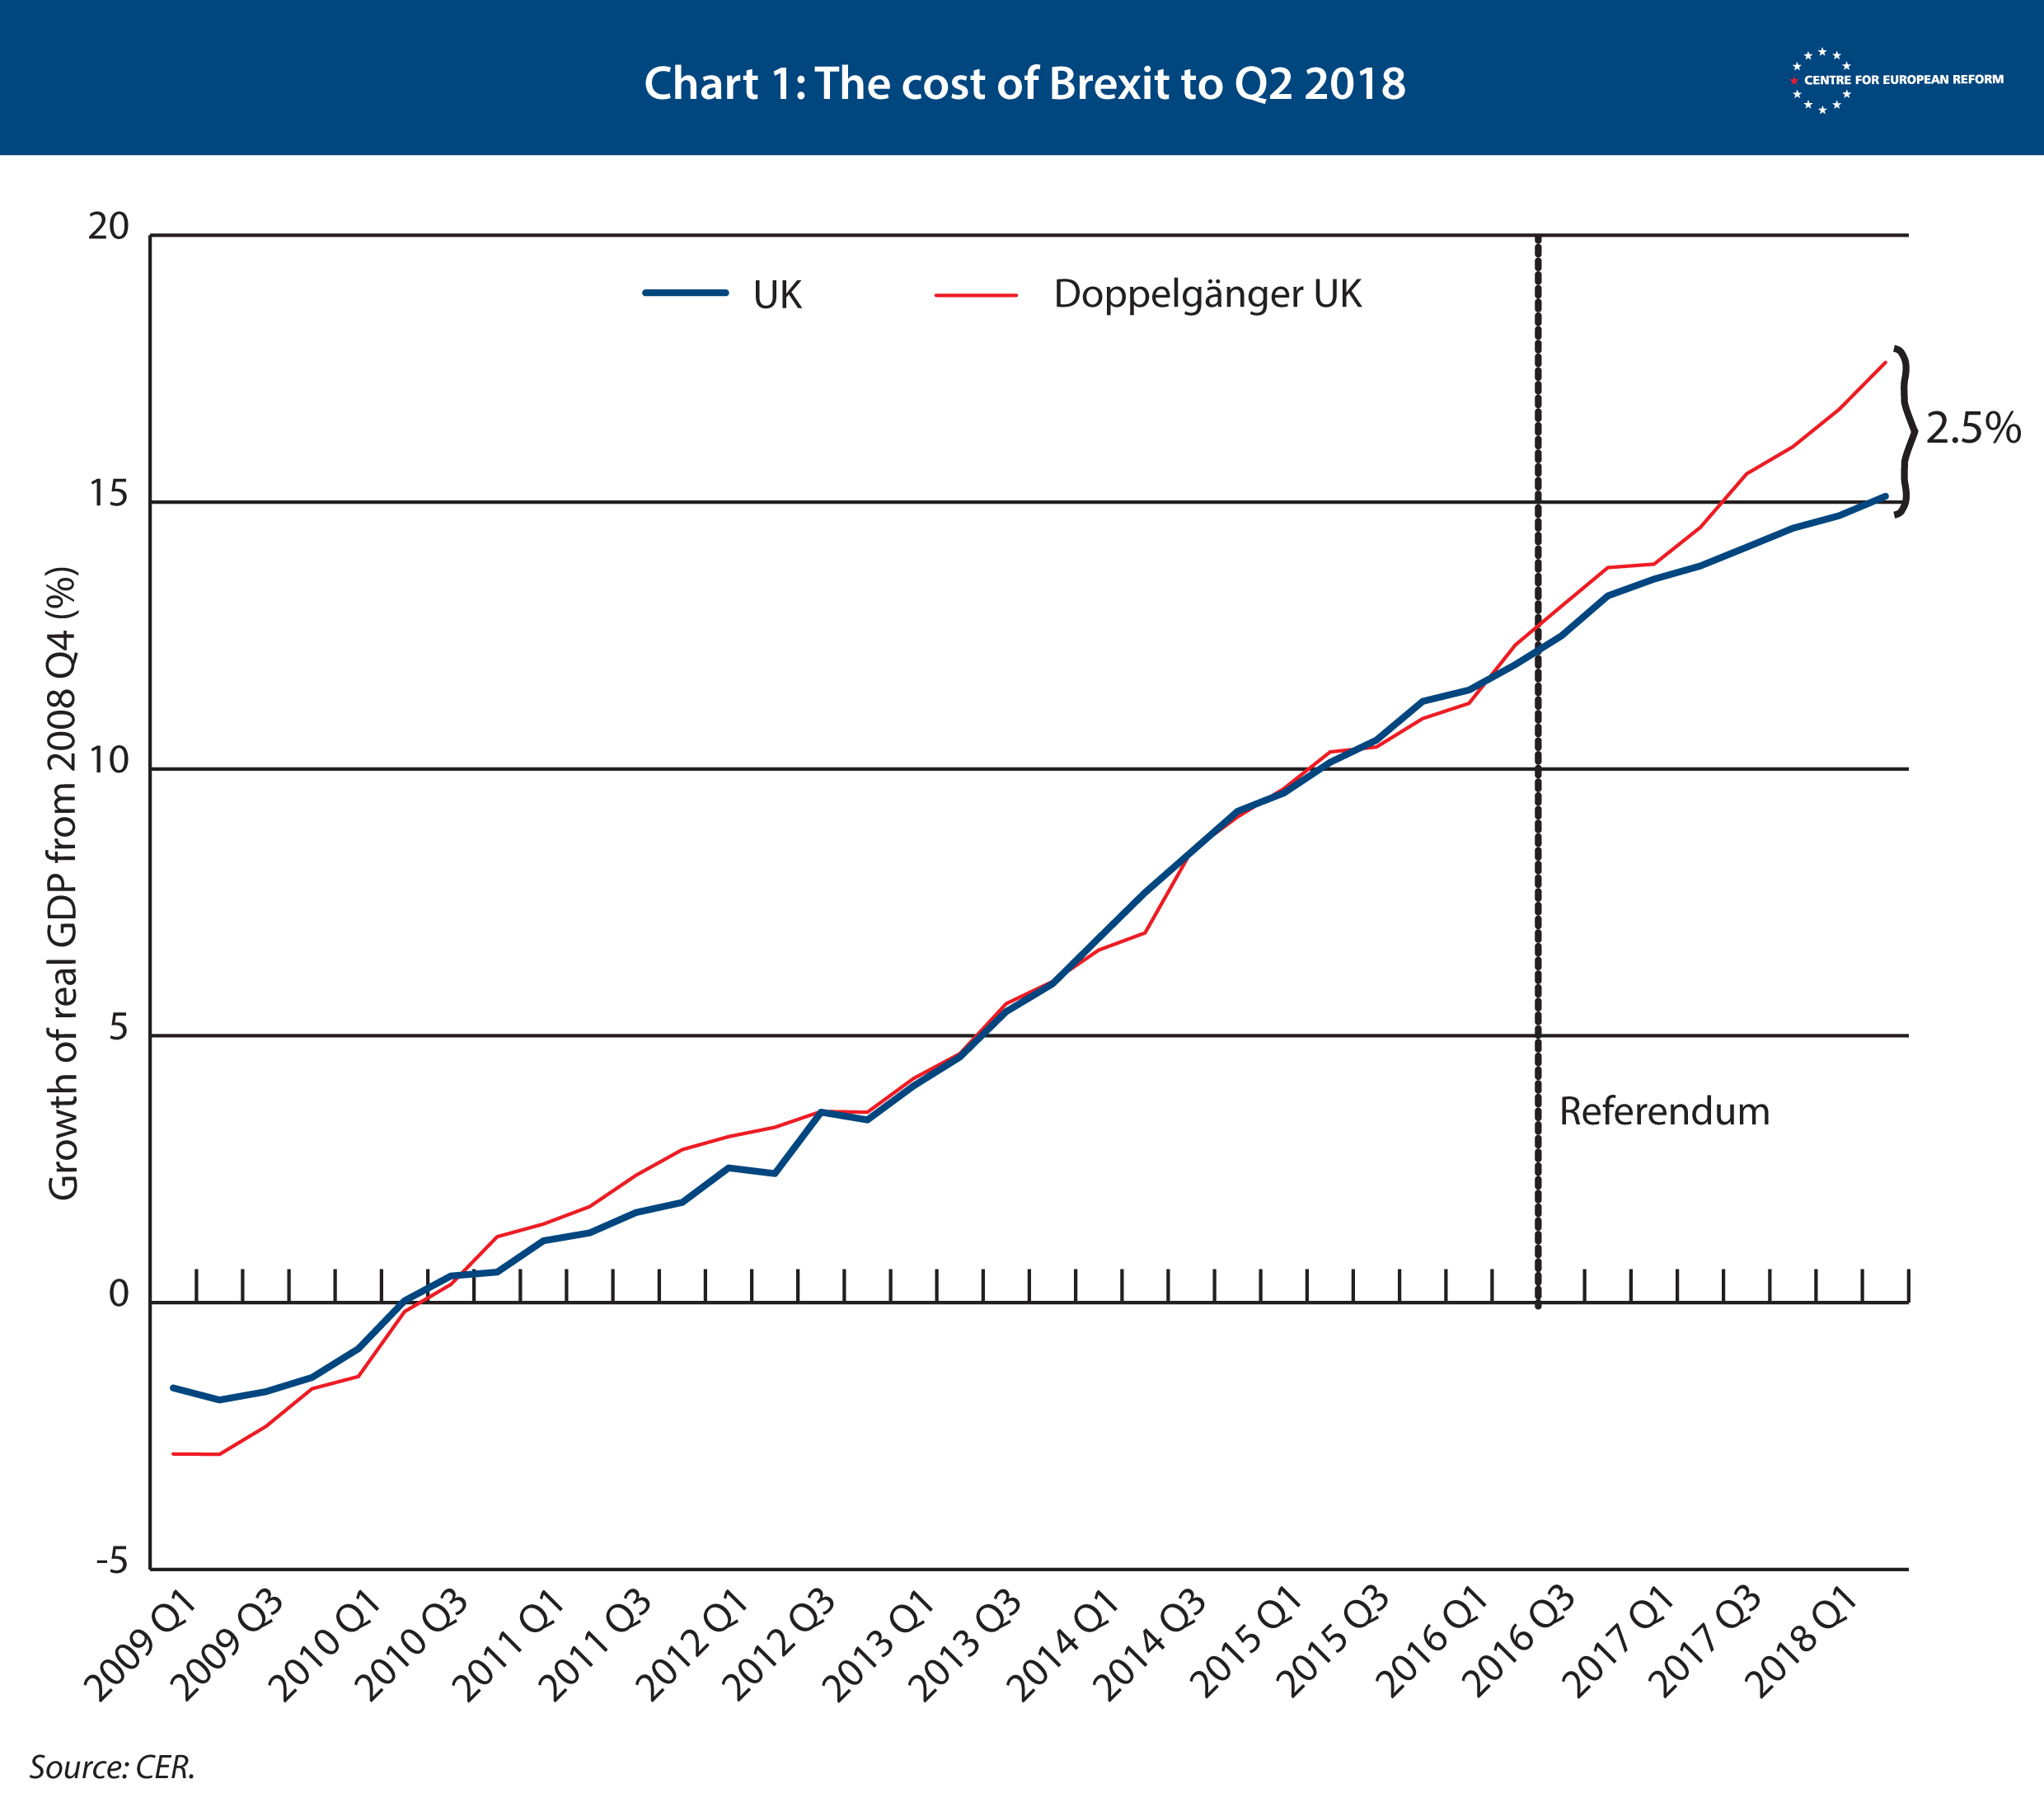
Chart 1 shows doppelgänger UK closely matched the economic growth of Britain until the referendum vote, but then the two series diverged. The cost of Brexit is the difference between the doppelgänger’s growth and the UK’s real growth data. Our latest estimate shows the economy is 2.5 per cent smaller than it would have been if Remain had won, and the gap is growing.
It is possible to work out how much extra borrowing the UK’s foregone output implies. The government’s own analysis of the cost of the various Brexit options, which was leaked in January, estimated how membership of the European Economic Area, a free trade agreement, or relying on World Trade Organisation rules to trade with the EU would hit the economy and public finances. This was based on a detailed analysis of taxes raised from different sectors of the economy, and how these Brexit options would damage them. The analysis found that 1 per cent of lost GDP resulted in £11 billion of extra borrowing. Since we have found that the cost so far is 2.5 per cent, that adds up to £26 billion additional borrowing. Our estimate shows there is no Brexit dividend: the Leave vote is now costing the Treasury £250 million a week. It also implies that the UK’s deficit would largely be eliminated in the 2018-19 financial year if Britain had voted to Remain. The August outturn of the public finances implies the actual deficit for this financial year will be around 1.4 per cent of GDP.
Some caveats are in order. First, the 2.5 per cent gap is a central estimate with a margin of error. On average, our doppelgänger deviates from the real UK by 0.26 percentage points in any given year. Second, the group of countries that make up the UK doppelgänger matches the UK closely up to the referendum, but we cannot rule out a positive ‘shock’ to some of the countries included – such as a surge in global demand for their exports – which the UK would not have enjoyed even if it had voted for Remain. That said, it is hard to say what growth the UK might have missed out on, given the broad-based global upswing in 2017. And our method is better than a method that compares UK performance before the referendum to its growth rate after it, since that takes no account of the fact that most economies were growing faster in 2017 than their pre-crisis trend, and one would expect the UK to be participating in that faster growth.
One way to sanity-check our estimate is to compare the UK’s growth to that of other comparable countries since the referendum. The UK has grown by 3.1 per cent over that period. Compare that to the average of the 22 most advanced economies: 5.2 per cent – which amounts to a 2.1 per cent gap, not far from our estimate of the cost of Brexit. We have taken 22 countries the IMF labelled as fully industrialised in 1995, to remove any countries that are experiencing faster rates of catch-up growth.
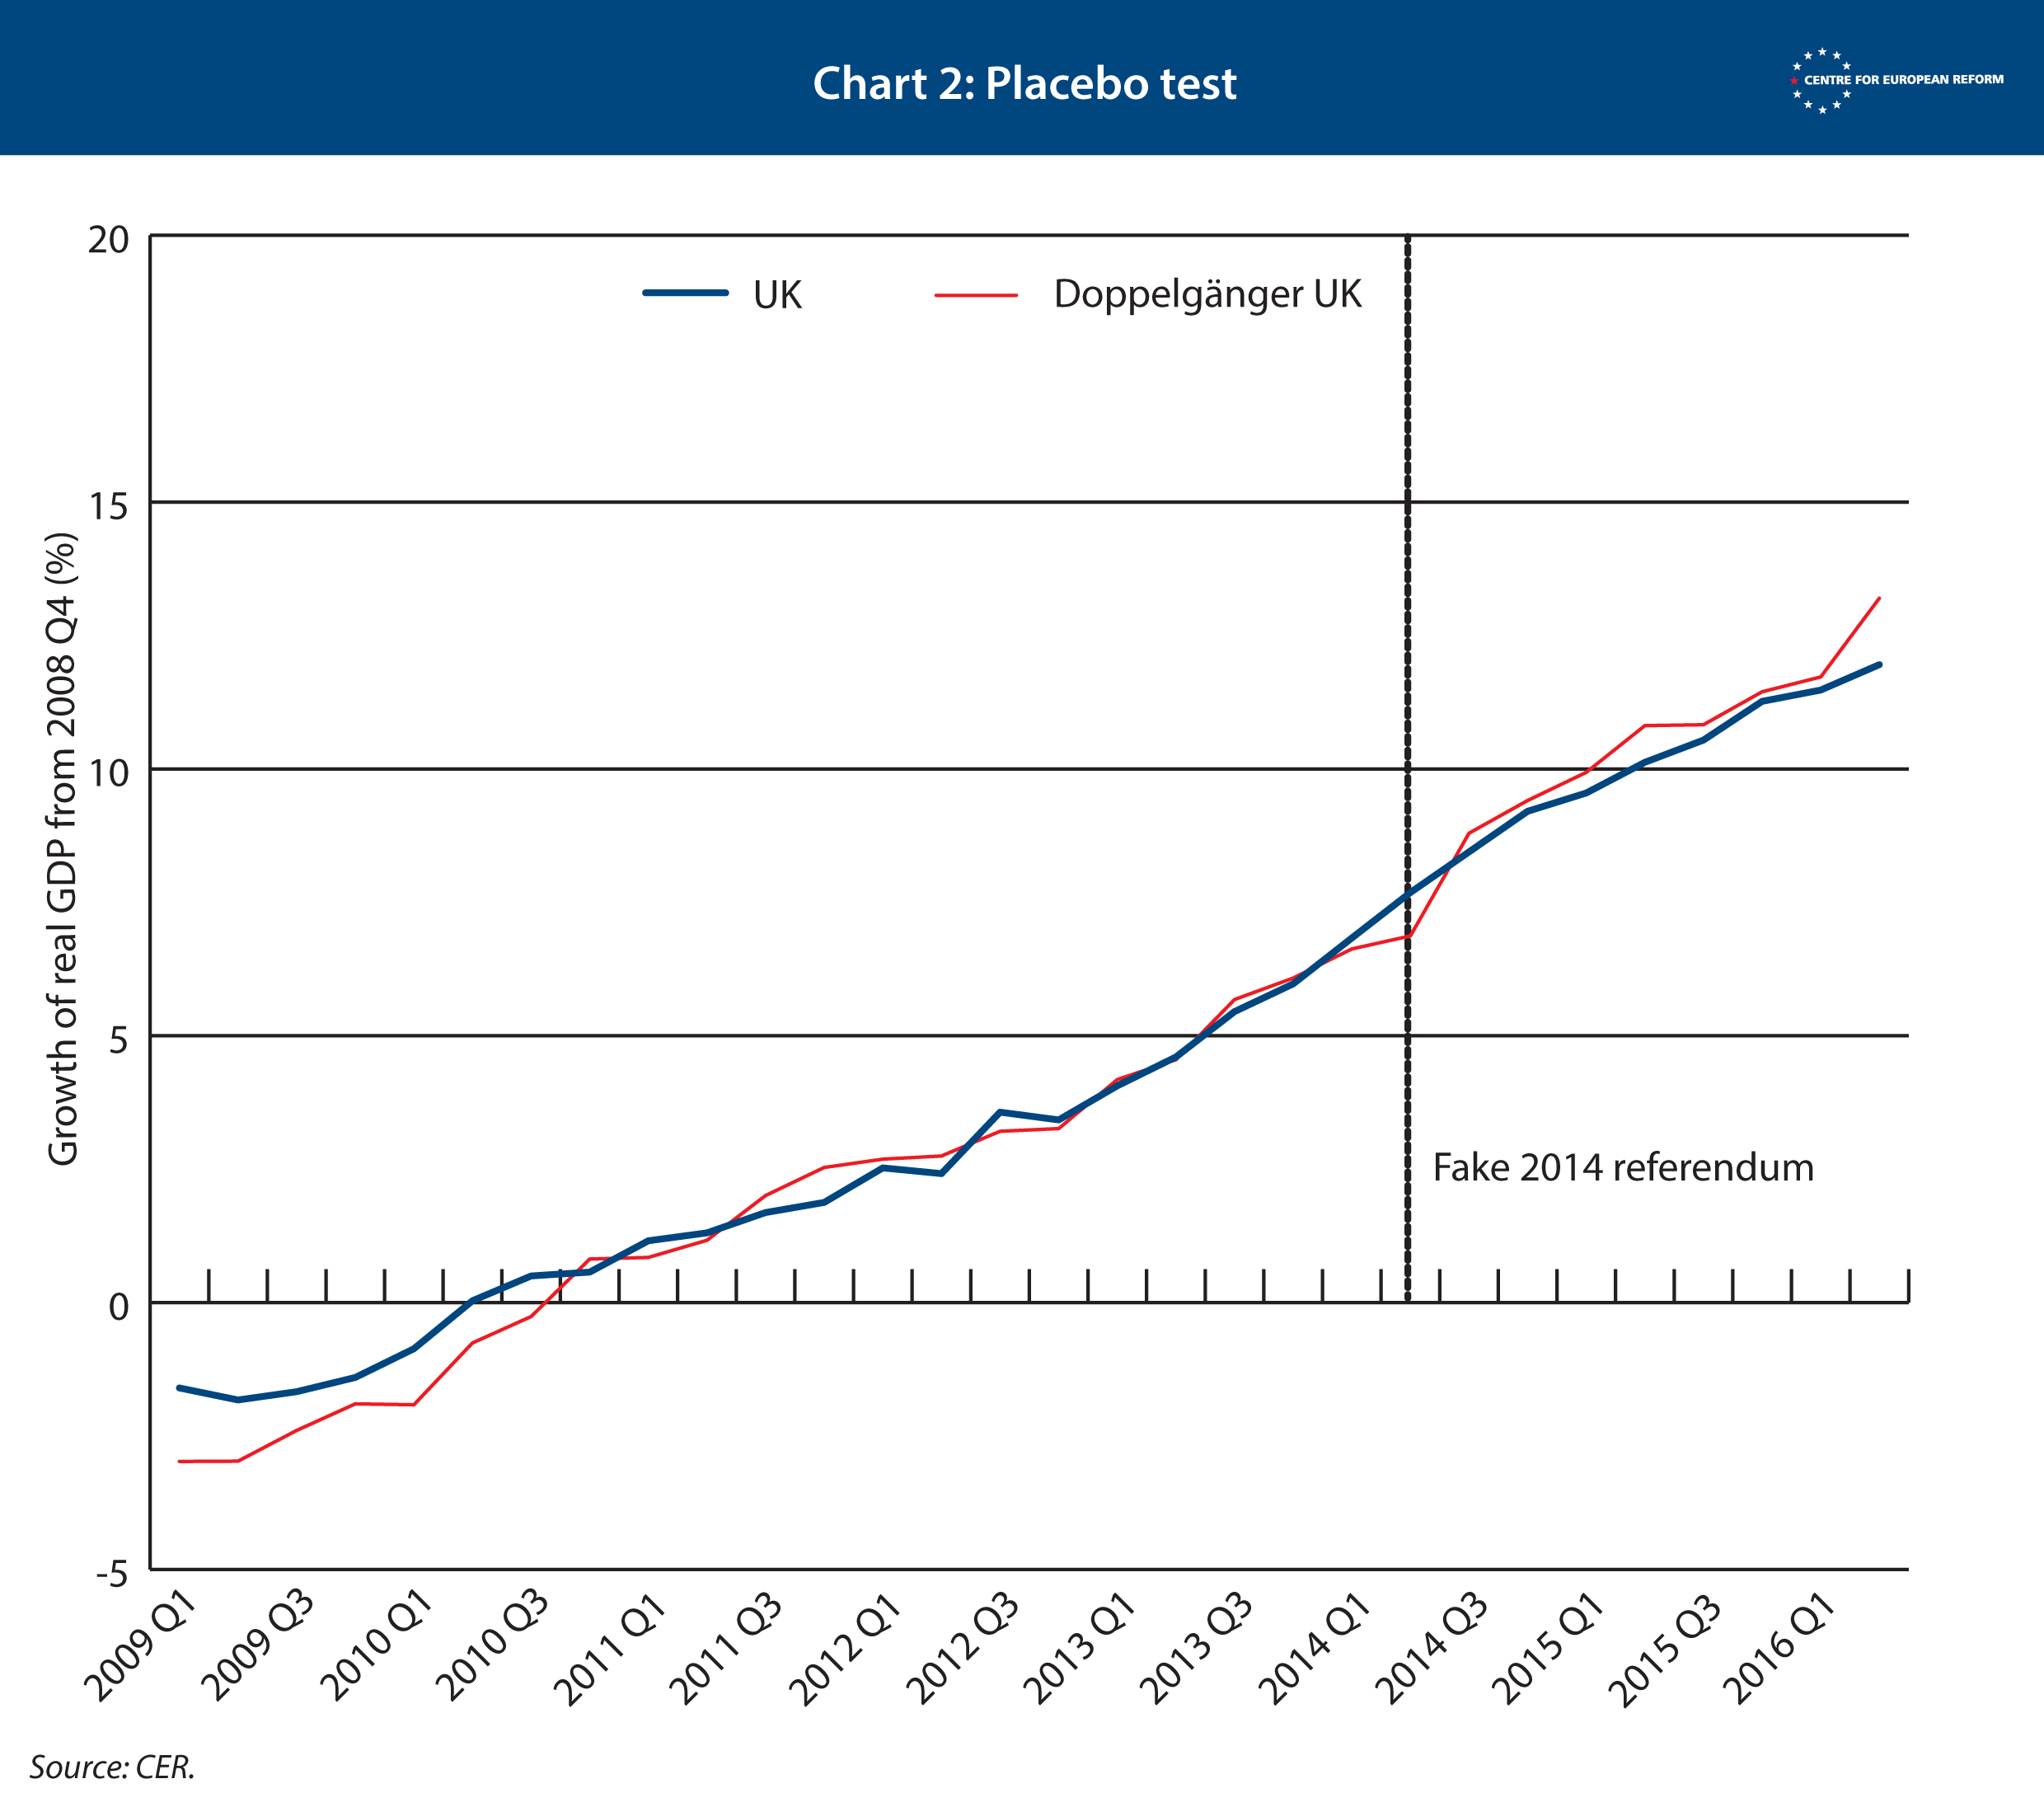
In order to check how strong our model is in predicting UK GDP, we ran two tests. The first is called a ‘placebo test’. We gave our doppelgänger UK a ‘fake’ referendum, which took place two years earlier, in 2014. This means that the program would find the countries that best matched the UK economy up to 2014, and then project the synthetic UK forward from that date. We wanted to check that the synthetic UK tracked real GDP in the subsequent years despite holding a fake referendum (which, as it is fake, should have no impact on GDP). Chart 2 shows the results of that placebo test. It shows that the doppelgänger UK did not react to the referendum, which means that it is able to predict the future path of UK GDP accurately.
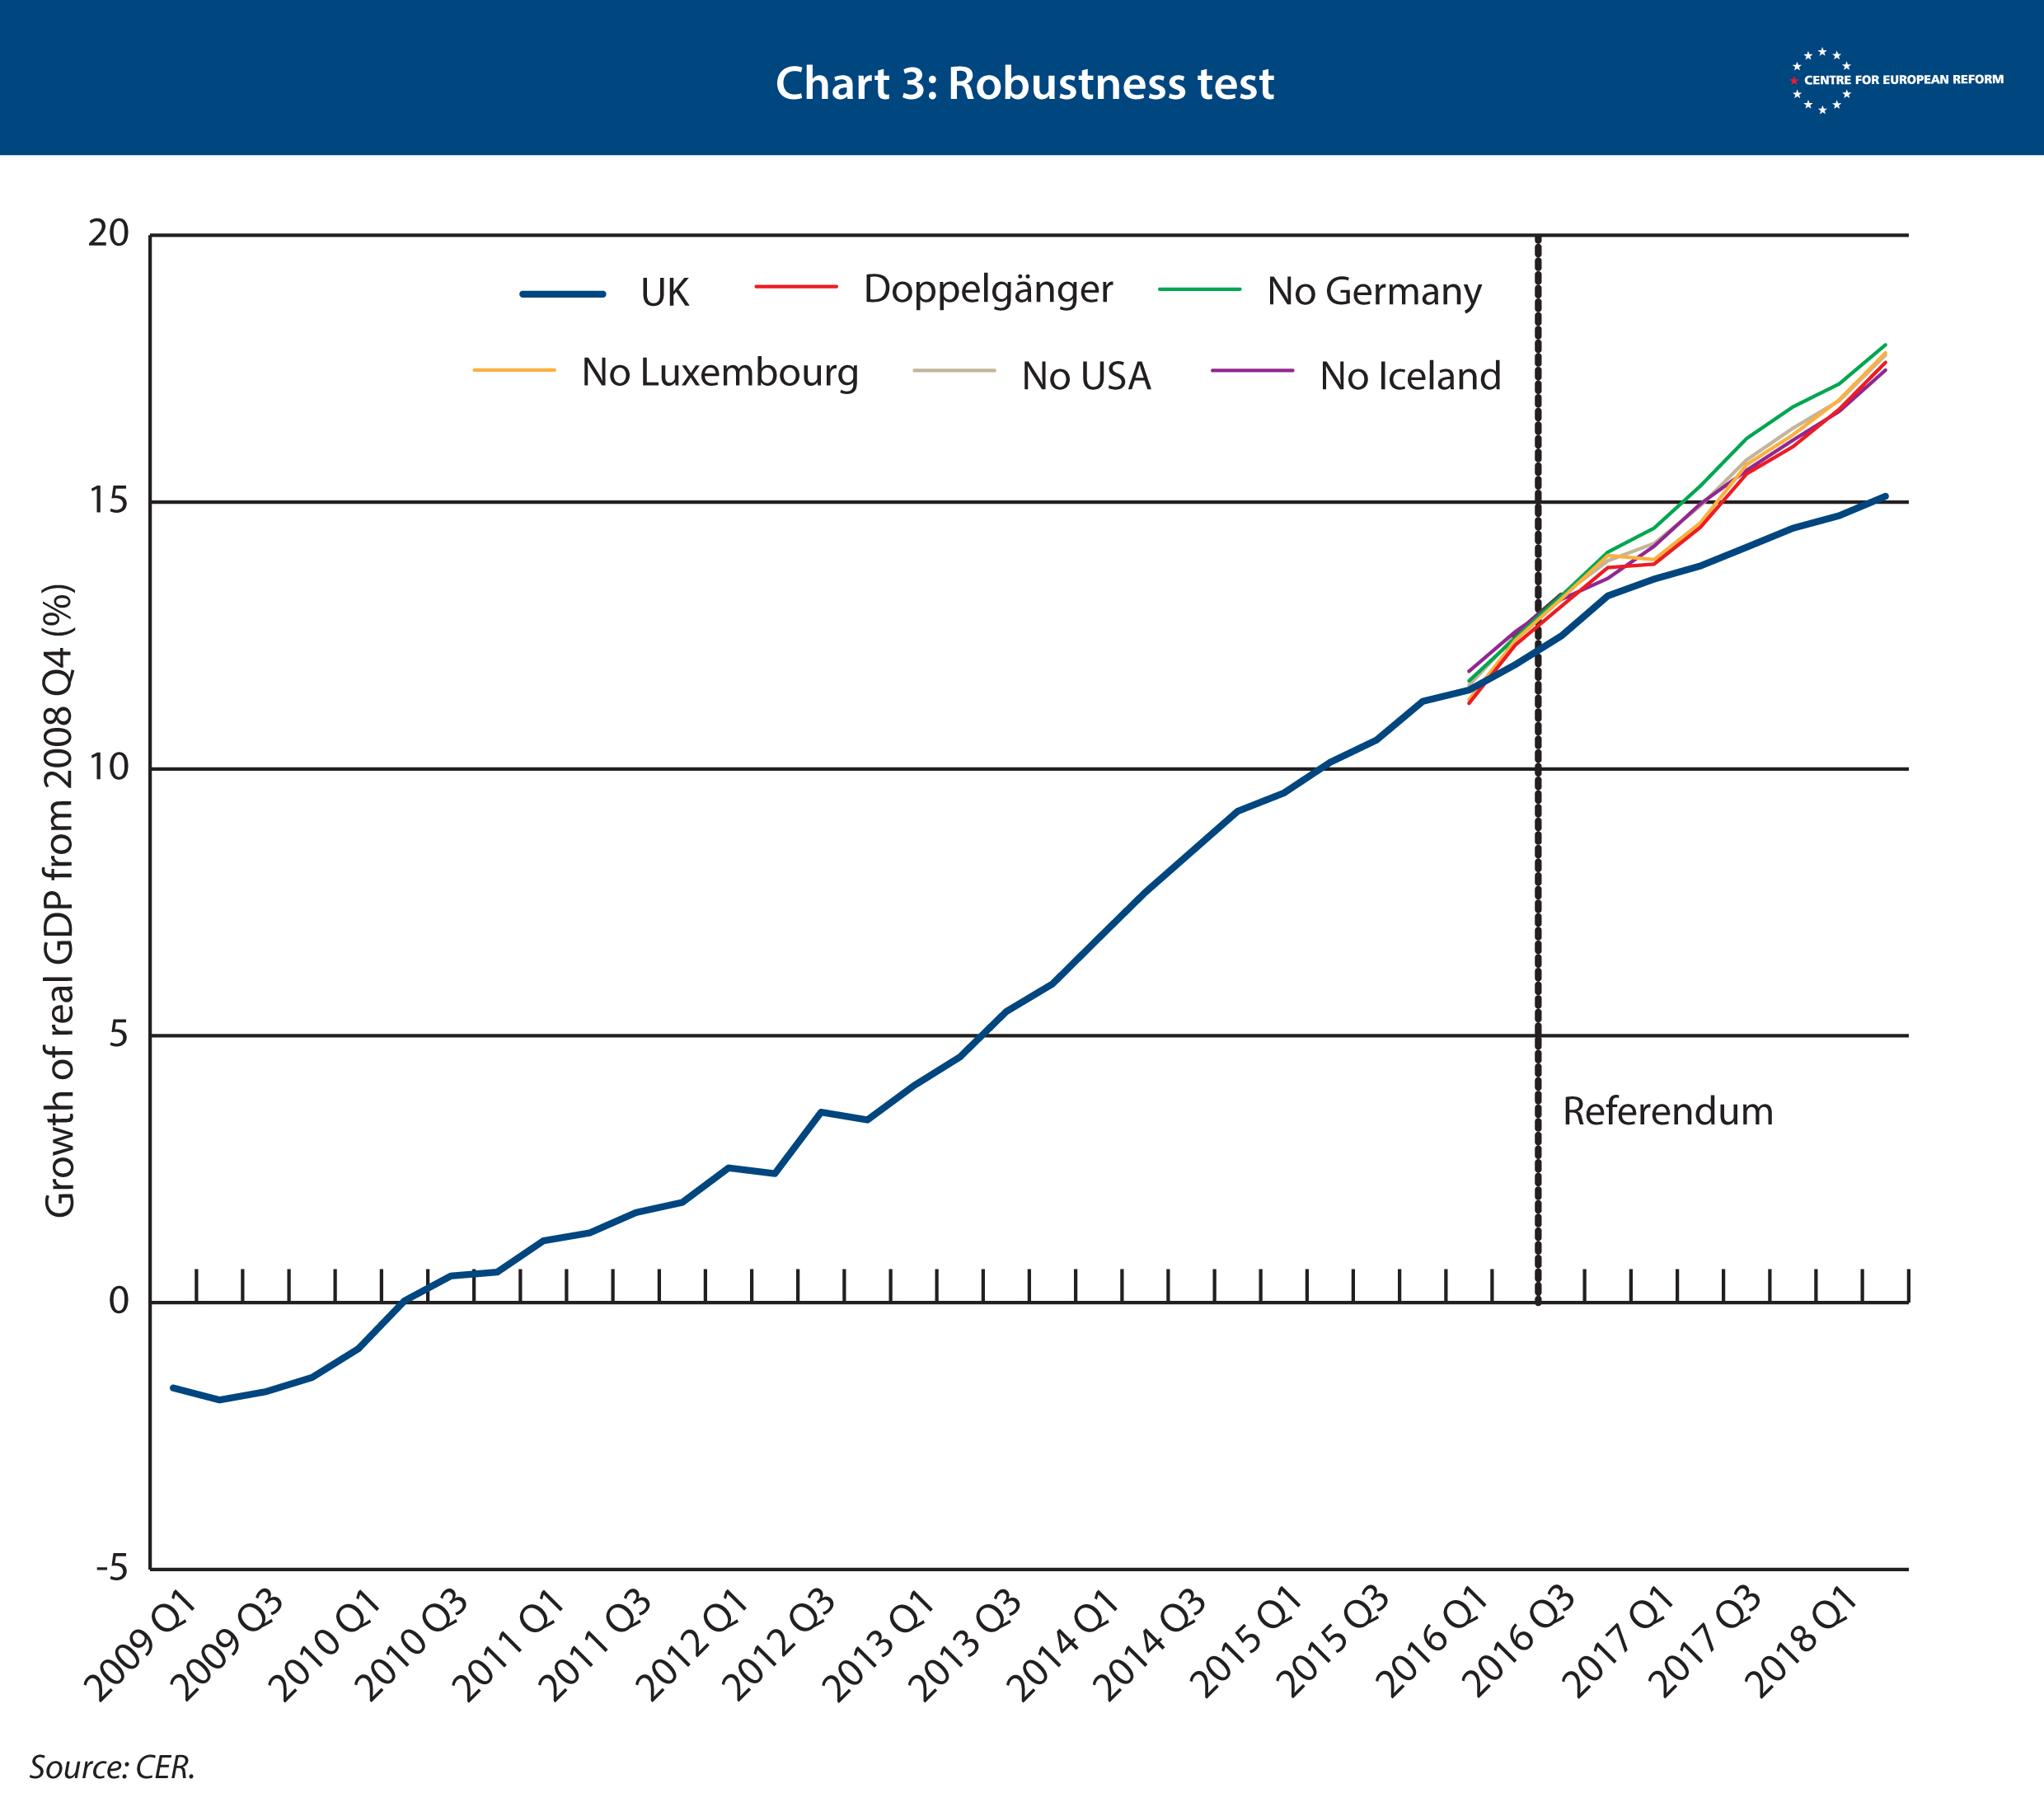
The second is a ‘robustness test’. We tested whether we can exclude certain countries that the computer program has selected from the doppelgänger – such as the US – and still get the same result. If that is the case, the model follows UK GDP closely, and is not too dependent on an individual country in the mix of countries that make up the doppelgänger UK. When we excluded each country in turn that made up the doppelgänger UK the results did not change much, showing that our model is robust. See Chart 3.
Time will tell whether ‘Project Fear’ overestimated the cost of Brexit, and the UK performs better than the overwhelming majority of economists predicted it would. The CER will update our model as new quarterly GDP data comes in – and as a result, we will have a decent basis to test the claims made by Leave and Remain. So far, our analysis shows the Remain campaign – and the vast majority of professional economists – have been closer to the truth.
Interested readers can see the source dataset here, the STATA script here and the results here.
Appendix
Thanks to helpful feedback on our previous model, we have now revised the model that we are using to estimate the cost of Brexit.
There were two main criticisms.
One was that our previous dataset included many countries which are significantly poorer on a per capita basis than the UK. This meant that the model was comparing apples and oranges (or more accurately, an apple with a group that included apples and pears). This is not entirely true, as we are not directly comparing, say, Hungary to the UK. Rather, the estimated model is telling us that a mix of countries, including some poorer countries, closely matches the UK. After all, the UK is not just made up of London, but includes poorer regions which have similar per capita incomes to richer regions of Central and Eastern Europe.
The other criticism was that, by forcing the algorithm to find the doppelgänger which most closely matched the path of UK GDP since 1995, we were not creating a model with much ‘predictive power’. It would be better to make the algorithm take into account some other variables, not just the path of GDP, such as the inflation rate, how well educated the population was, and the investment/gross value added ratio. This would mean that the model would find countries whose economies were like that of the UK, rather than those whose growth, perhaps by coincidence, best matched the UK in the relevant period.
Taking those criticisms on board, we created some other models and tested them to see how credible the results were.
The original model, which we borrowed from a group of academics, offered an estimate of the cost of Brexit as 2.4 per cent of foregone growth in the second quarter of 2018. In that model, the UK’s doppelgänger included Canada (whose growth rate makes up 16 per cent of the doppelgänger’s), Japan (20 per cent), Hungary (23 per cent) and the US (24 per cent), with a few other, mostly European countries, making up the remainder. Hungary’s exceptional growth since the Brexit referendum – 8 per cent, compared to the UK’s 3.1 per cent – did bias this result upwards.
We then ran another model which included only the 22 mature economies mentioned above. This brought the estimate down to 1.6 per cent.
However, we then ran into the second criticism that people made. By forcing the model to match on GDP, rather than on a range of variables, it did not have much predictive power.
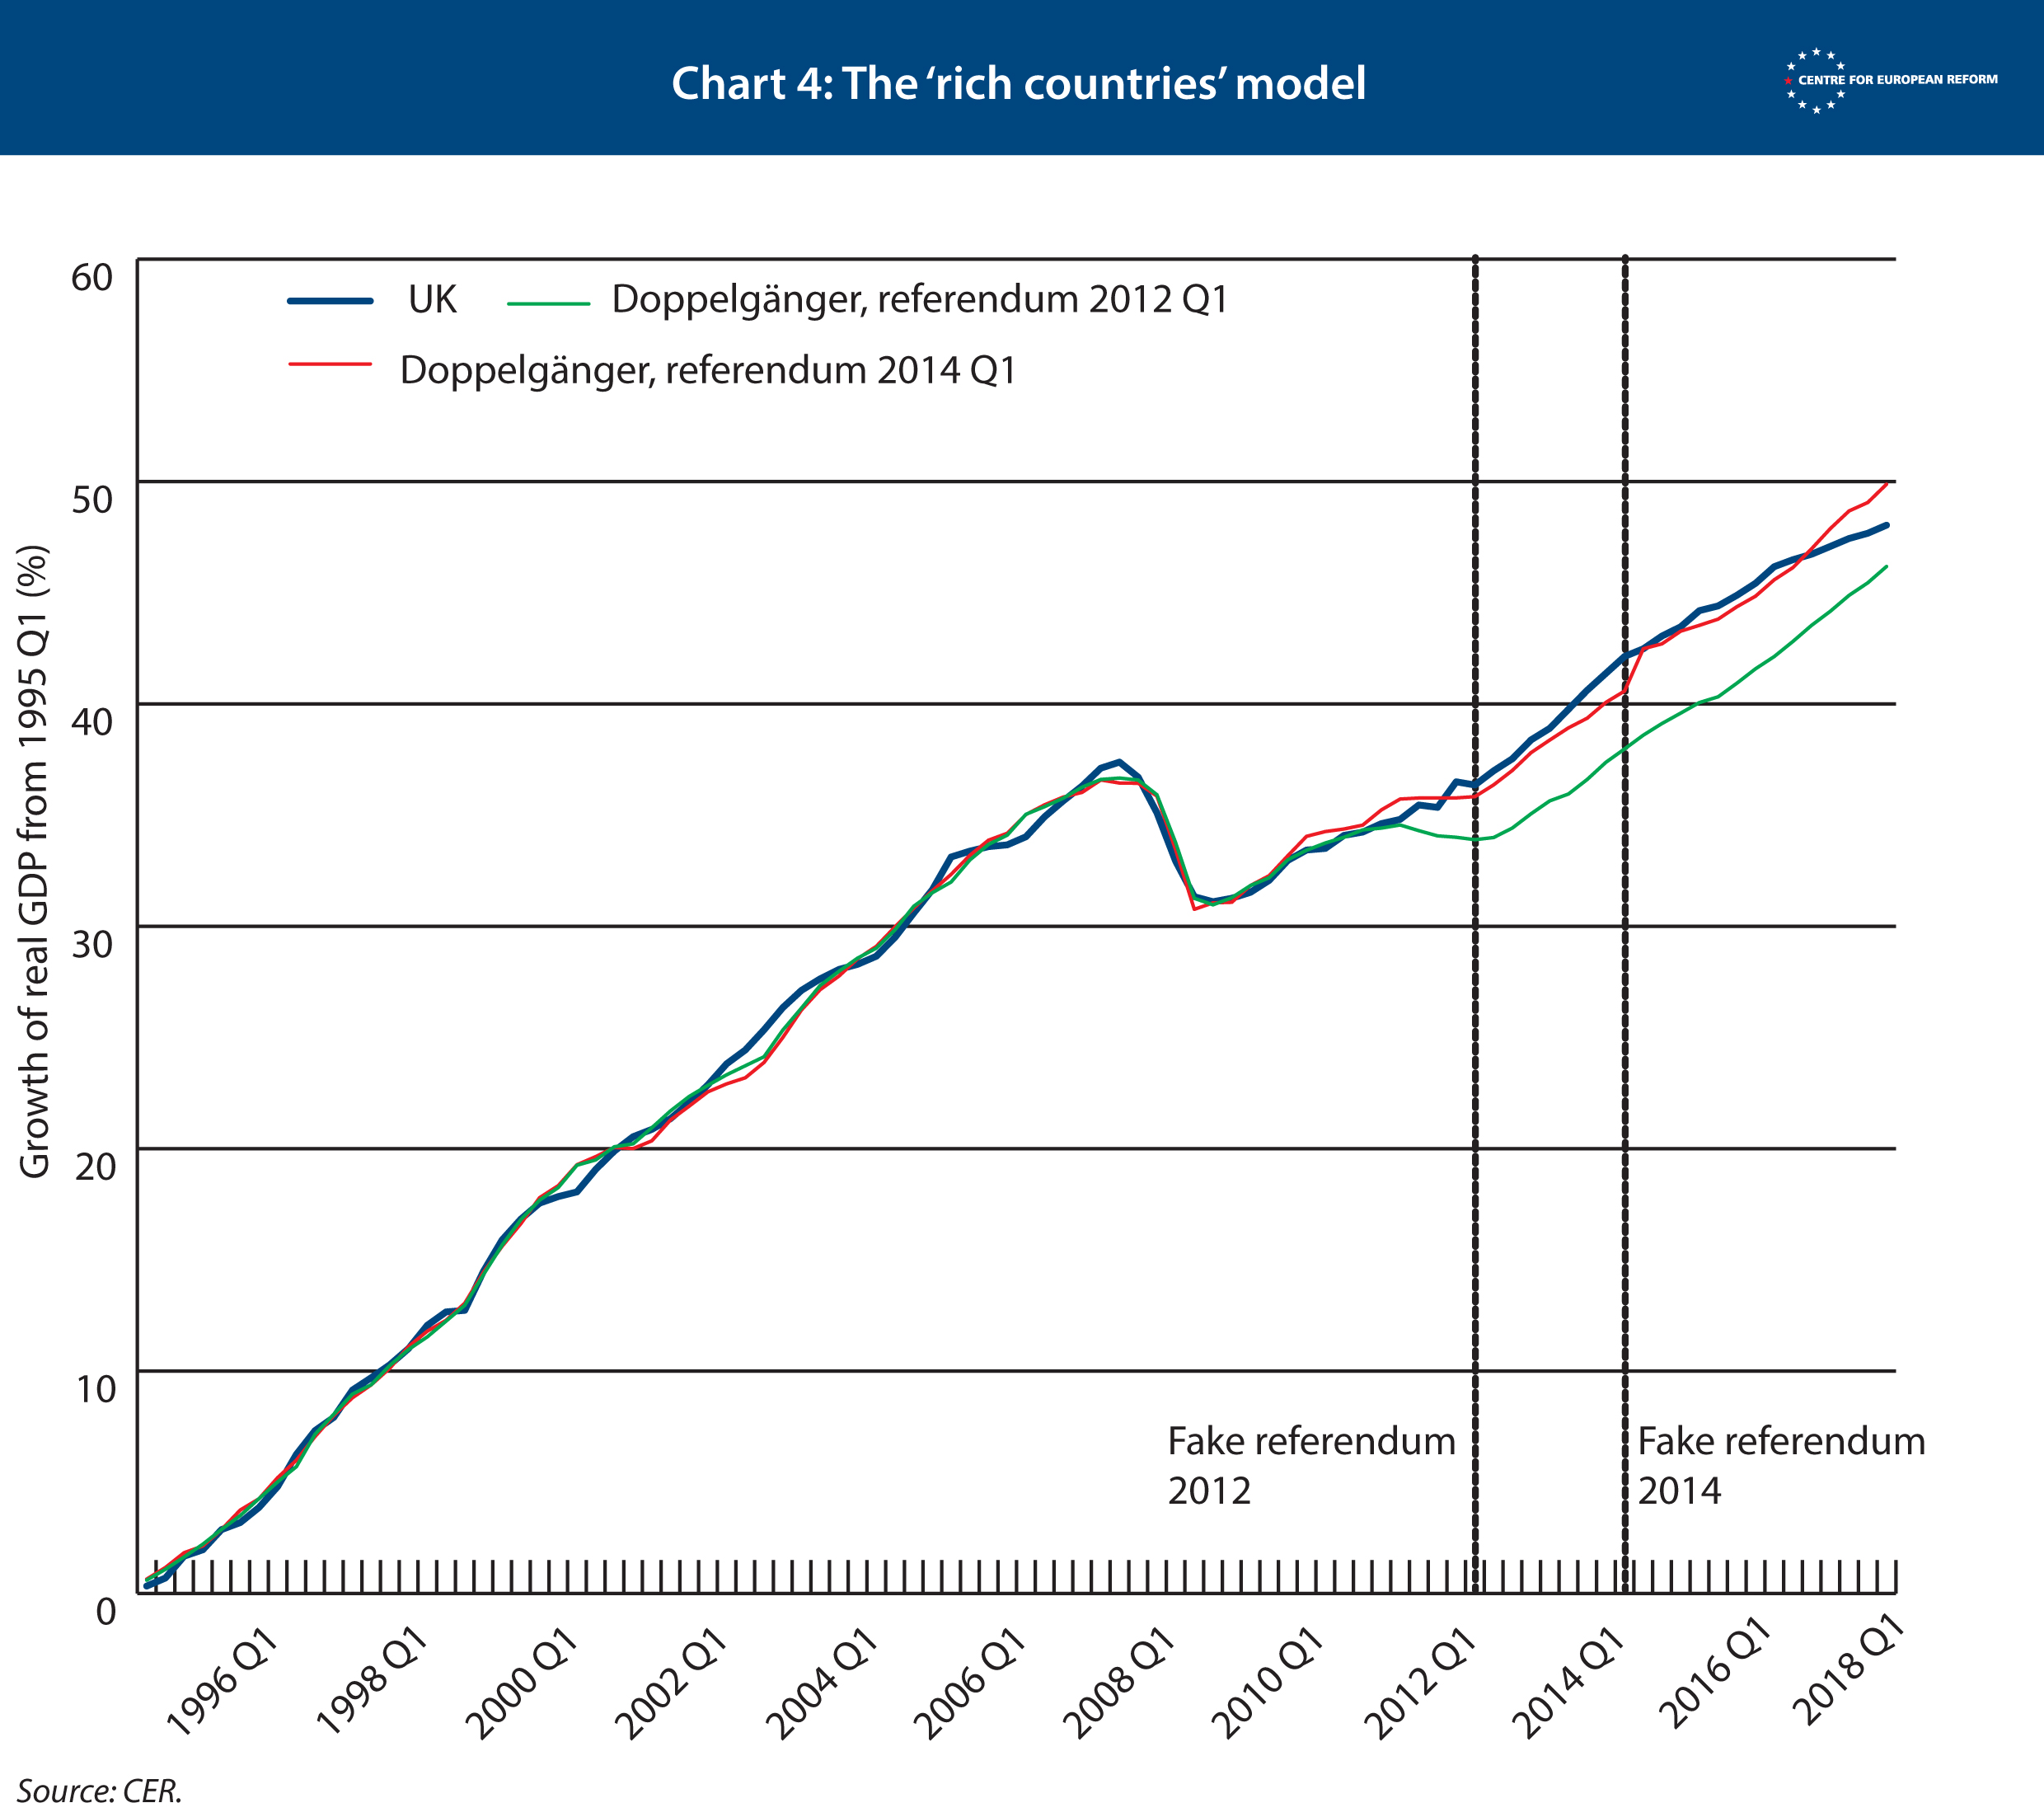
We discovered this by running two ‘placebo tests’. We first made the model think that the referendum was held in the first quarter of 2014. This helps us to identify if the model could predict the path of UK GDP after 2014, and therefore whether the doppelgänger that best matched UK GDP up to 2014 matched UK GDP afterwards, too. It matched it fairly closely, both before and after this 'placebo referendum'. However, if we moved the placebo referendum back to the first quarter of 2012, the doppelgänger gave a high weight to Italy. This meant that the model thought the UK would perform much more poorly after 2012 than it did in reality, as a result of Italy’s poor post-crisis performance. The Great Recession hit both Italy and the UK very hard, but for different reasons, and Italy’s recovery has been much weaker than Britain’s. So it is not surprising that the model failed our 2012 placebo referendum test.
In the statistics jargon, the model is ‘overfitted’. This means the model is robotically finding the best countries that match the path of UK GDP over the period, irrespective of whether their economies are in fact similar to the UK. This can lead us into the trap of giving too high a weight to Italy or Hungary.
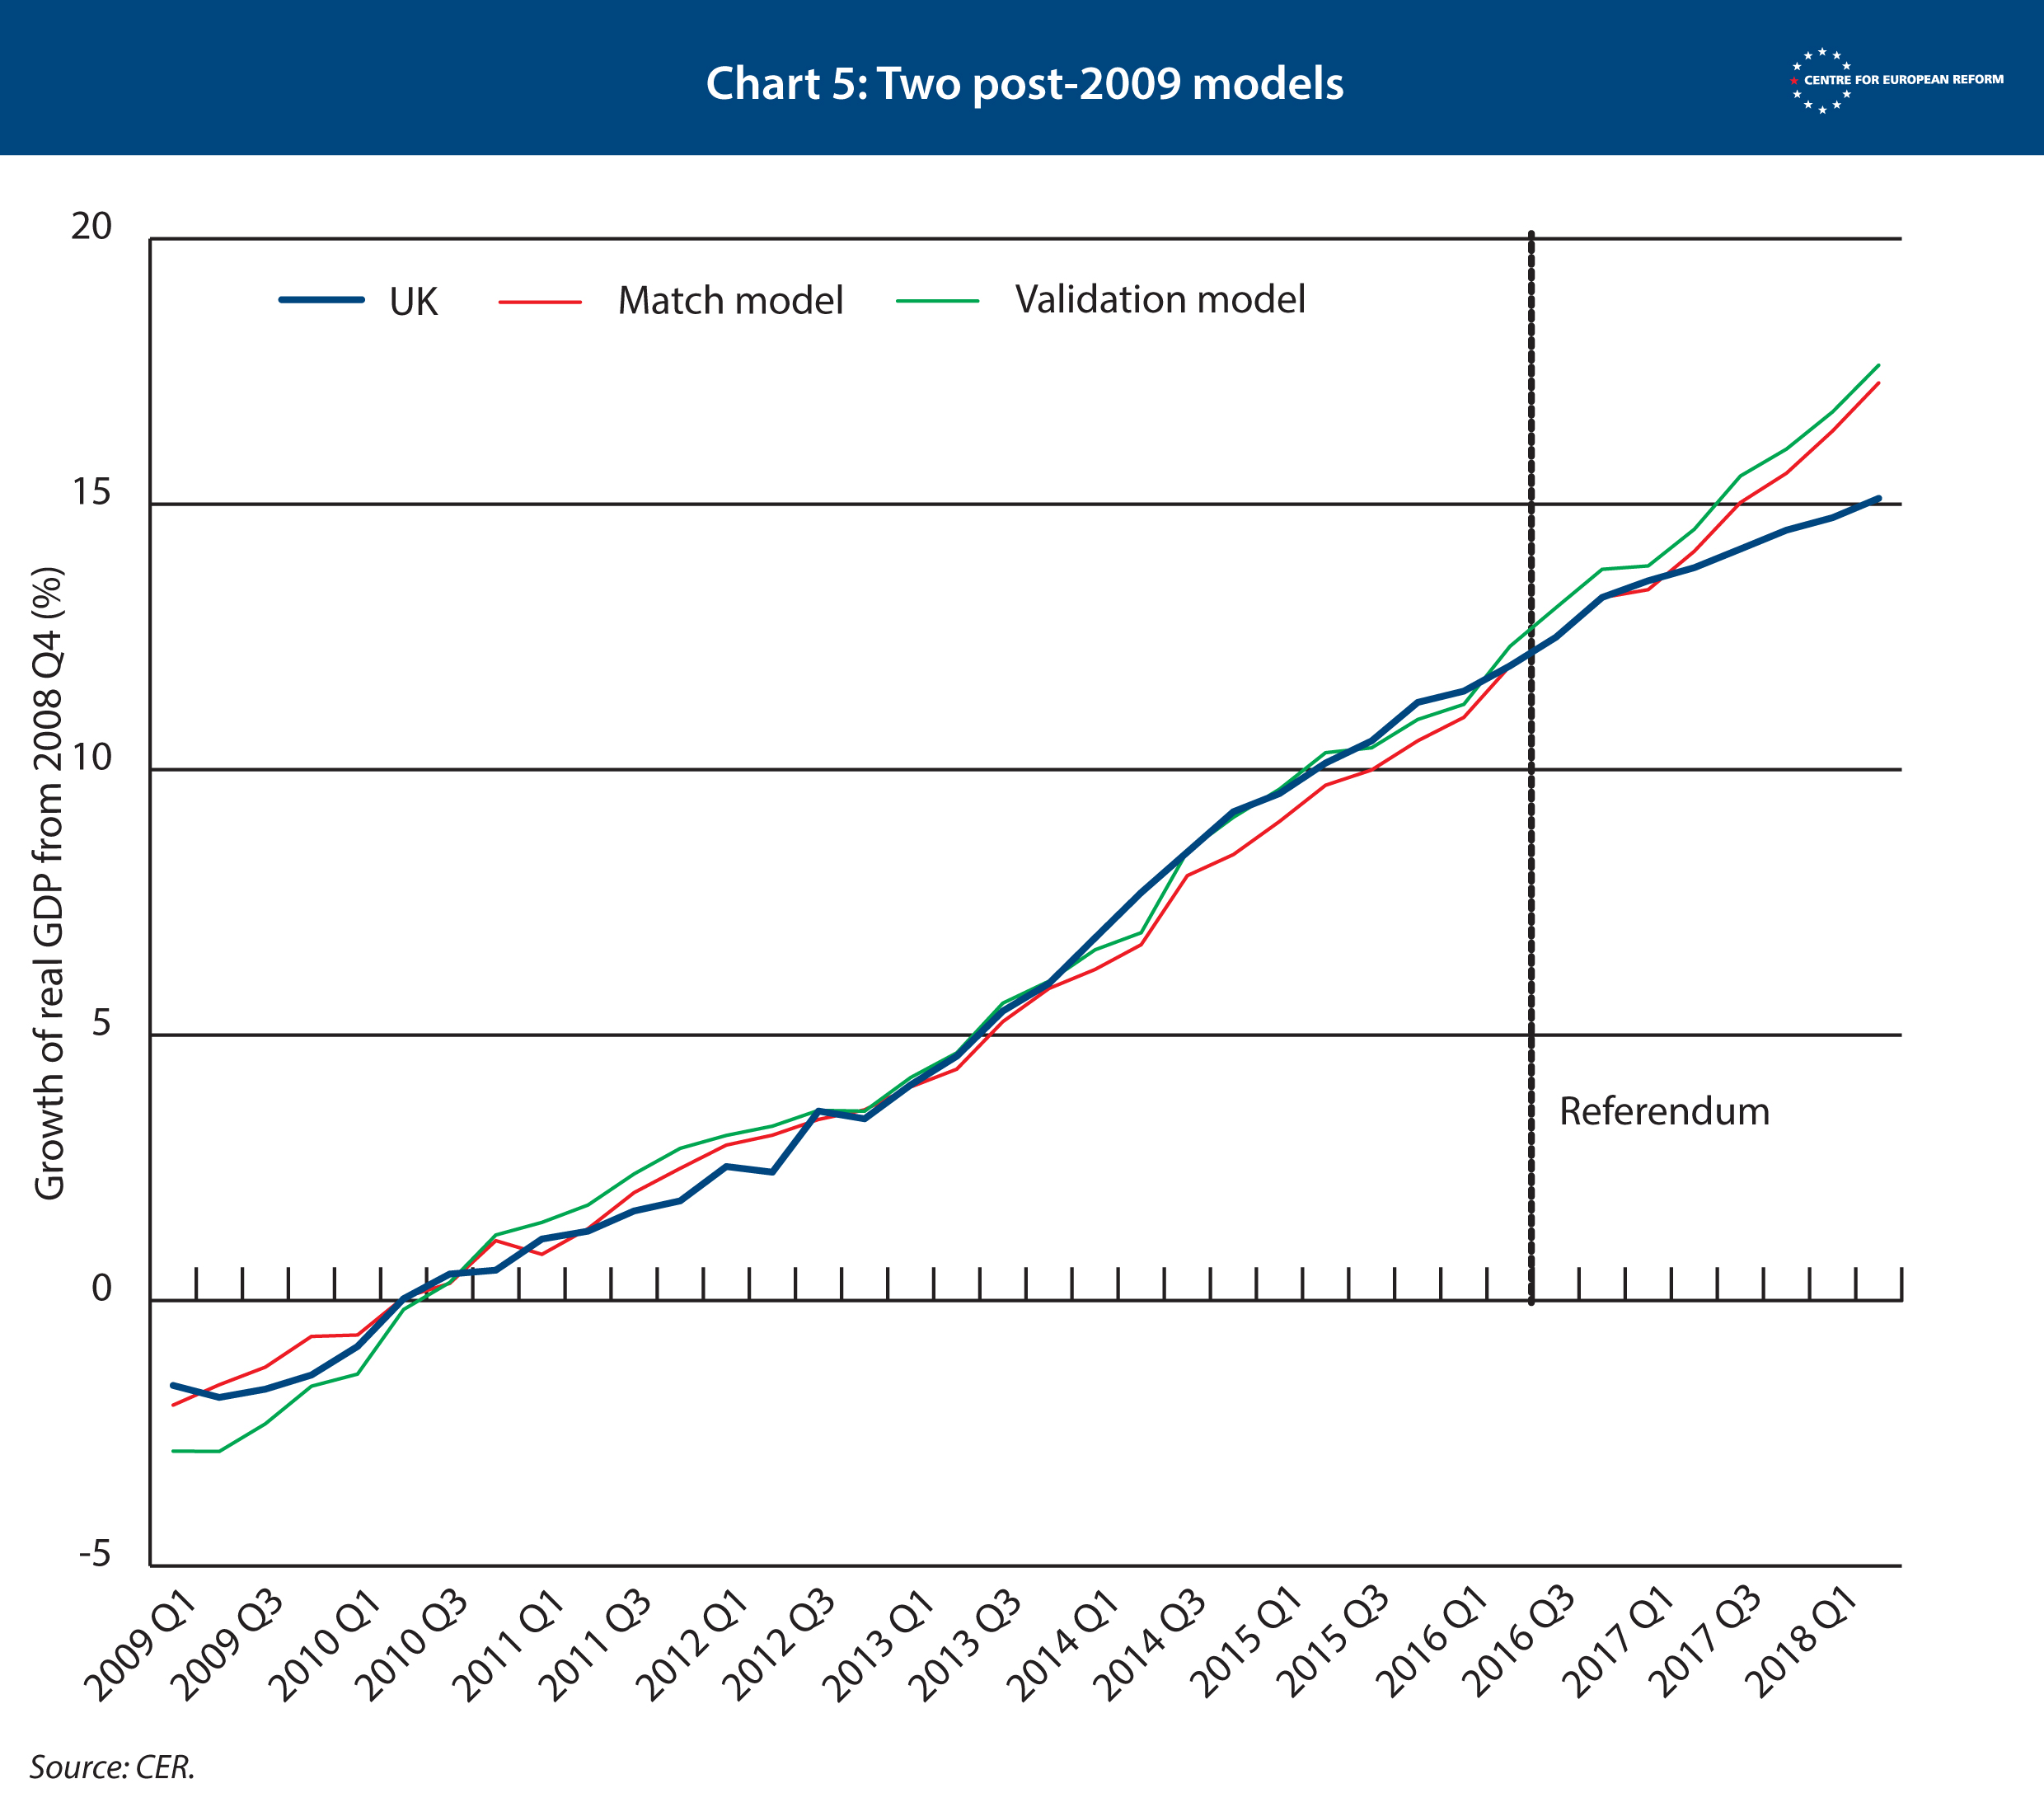
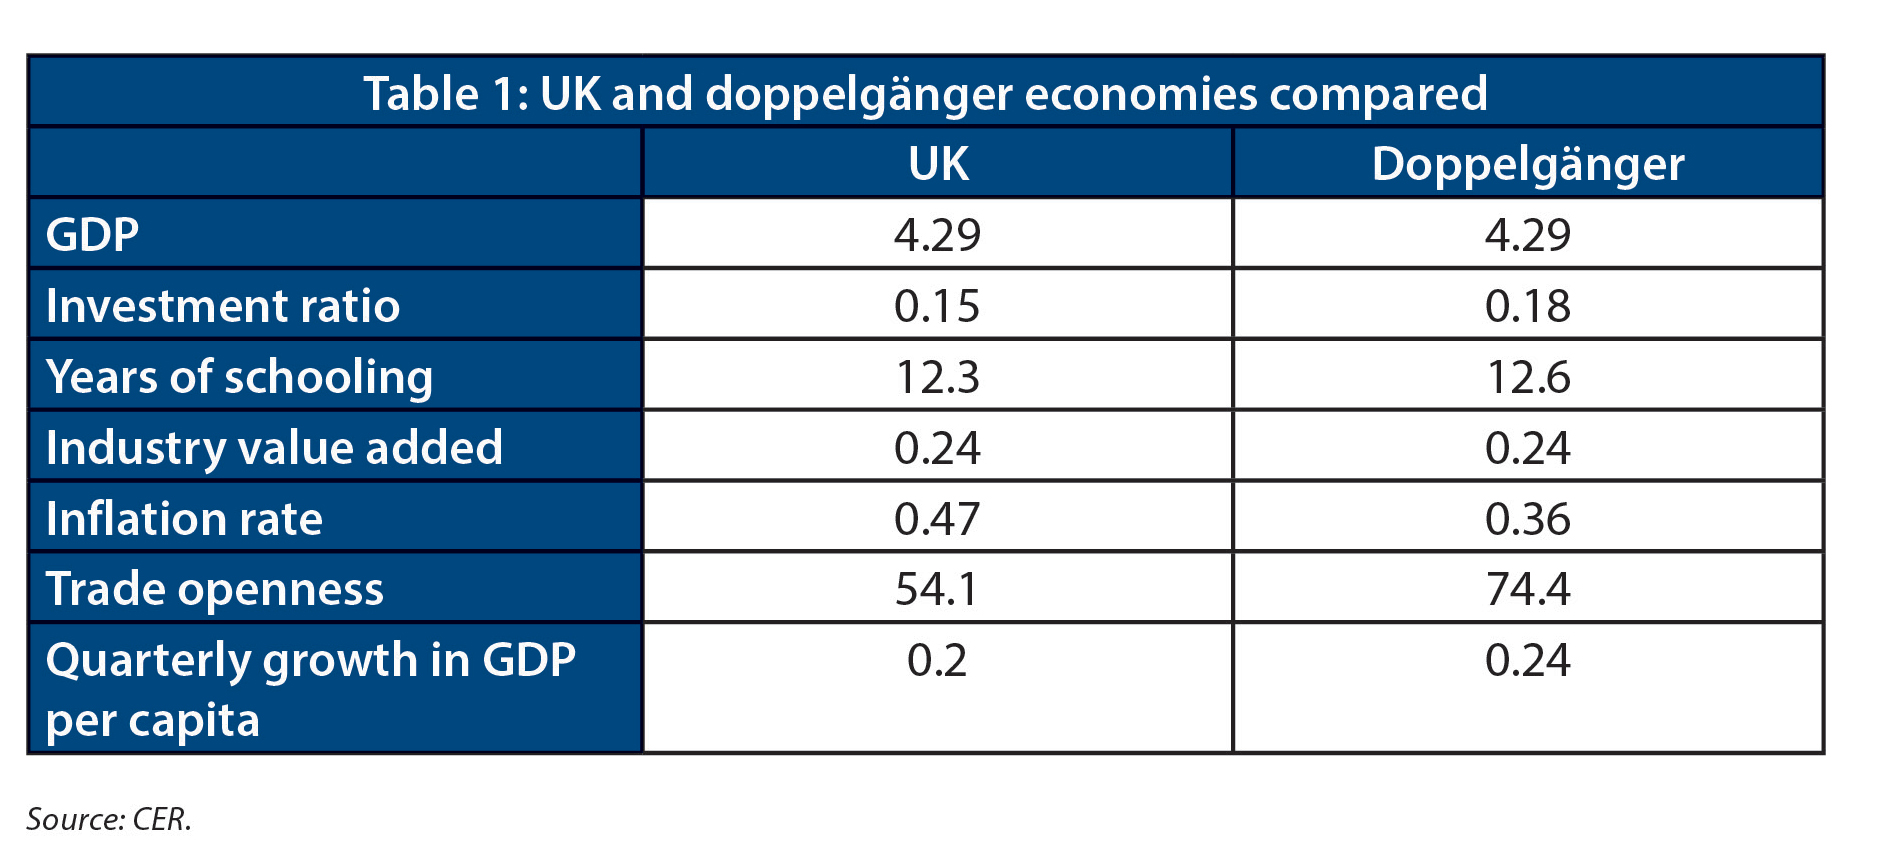
In order to overcome this problem, we designed two models. In the first, the 'match model', we used several variables other than GDP that characterise an economy: the ratio of total trade to GDP; the inflation rate; the share of industrial value added in total value added; the average years of schooling of the adult population; the growth of real GDP per capita; and the ratio of private and public sector investment to GDP. The algorithm was then asked to ‘match’ countries that were most comparable to the UK in all of these variables, and also on one data point for GDP – in the second quarter of 2016, at the very end of which the referendum took place.
The second model was a ‘validation model’, in which we also included the other variables from the match model. But here, we also split the pre-referendum period into two. The model was then asked to ‘train’ itself in the first half of the period, and create a doppelgänger that most closely matches the UK on GDP and all the other variables. In the second half of the period, it was asked to minimise the error between the UK and that of the doppelgänger, which meant it largely focused on GDP. This is the model that the team that came up with the synthetic control method, led by Alberto Abadie, used to estimate the cost of German reunification. These two models should deal with the overfitting problem.
However, the algorithm found it very difficult to find a country that matched all of the other variables with the UK’s path of GDP, since the UK had such an idiosyncratic Great Recession (characterised by a very large and sudden drop in GDP).
To overcome that problem, we started the series in the first quarter of 2009, around the trough of the recession for the UK. The results of both models, the match and the validation model, are shown in Chart 3. They produced similar results: 2.5 per cent for the validation model, and 2.2 per cent for the match model.
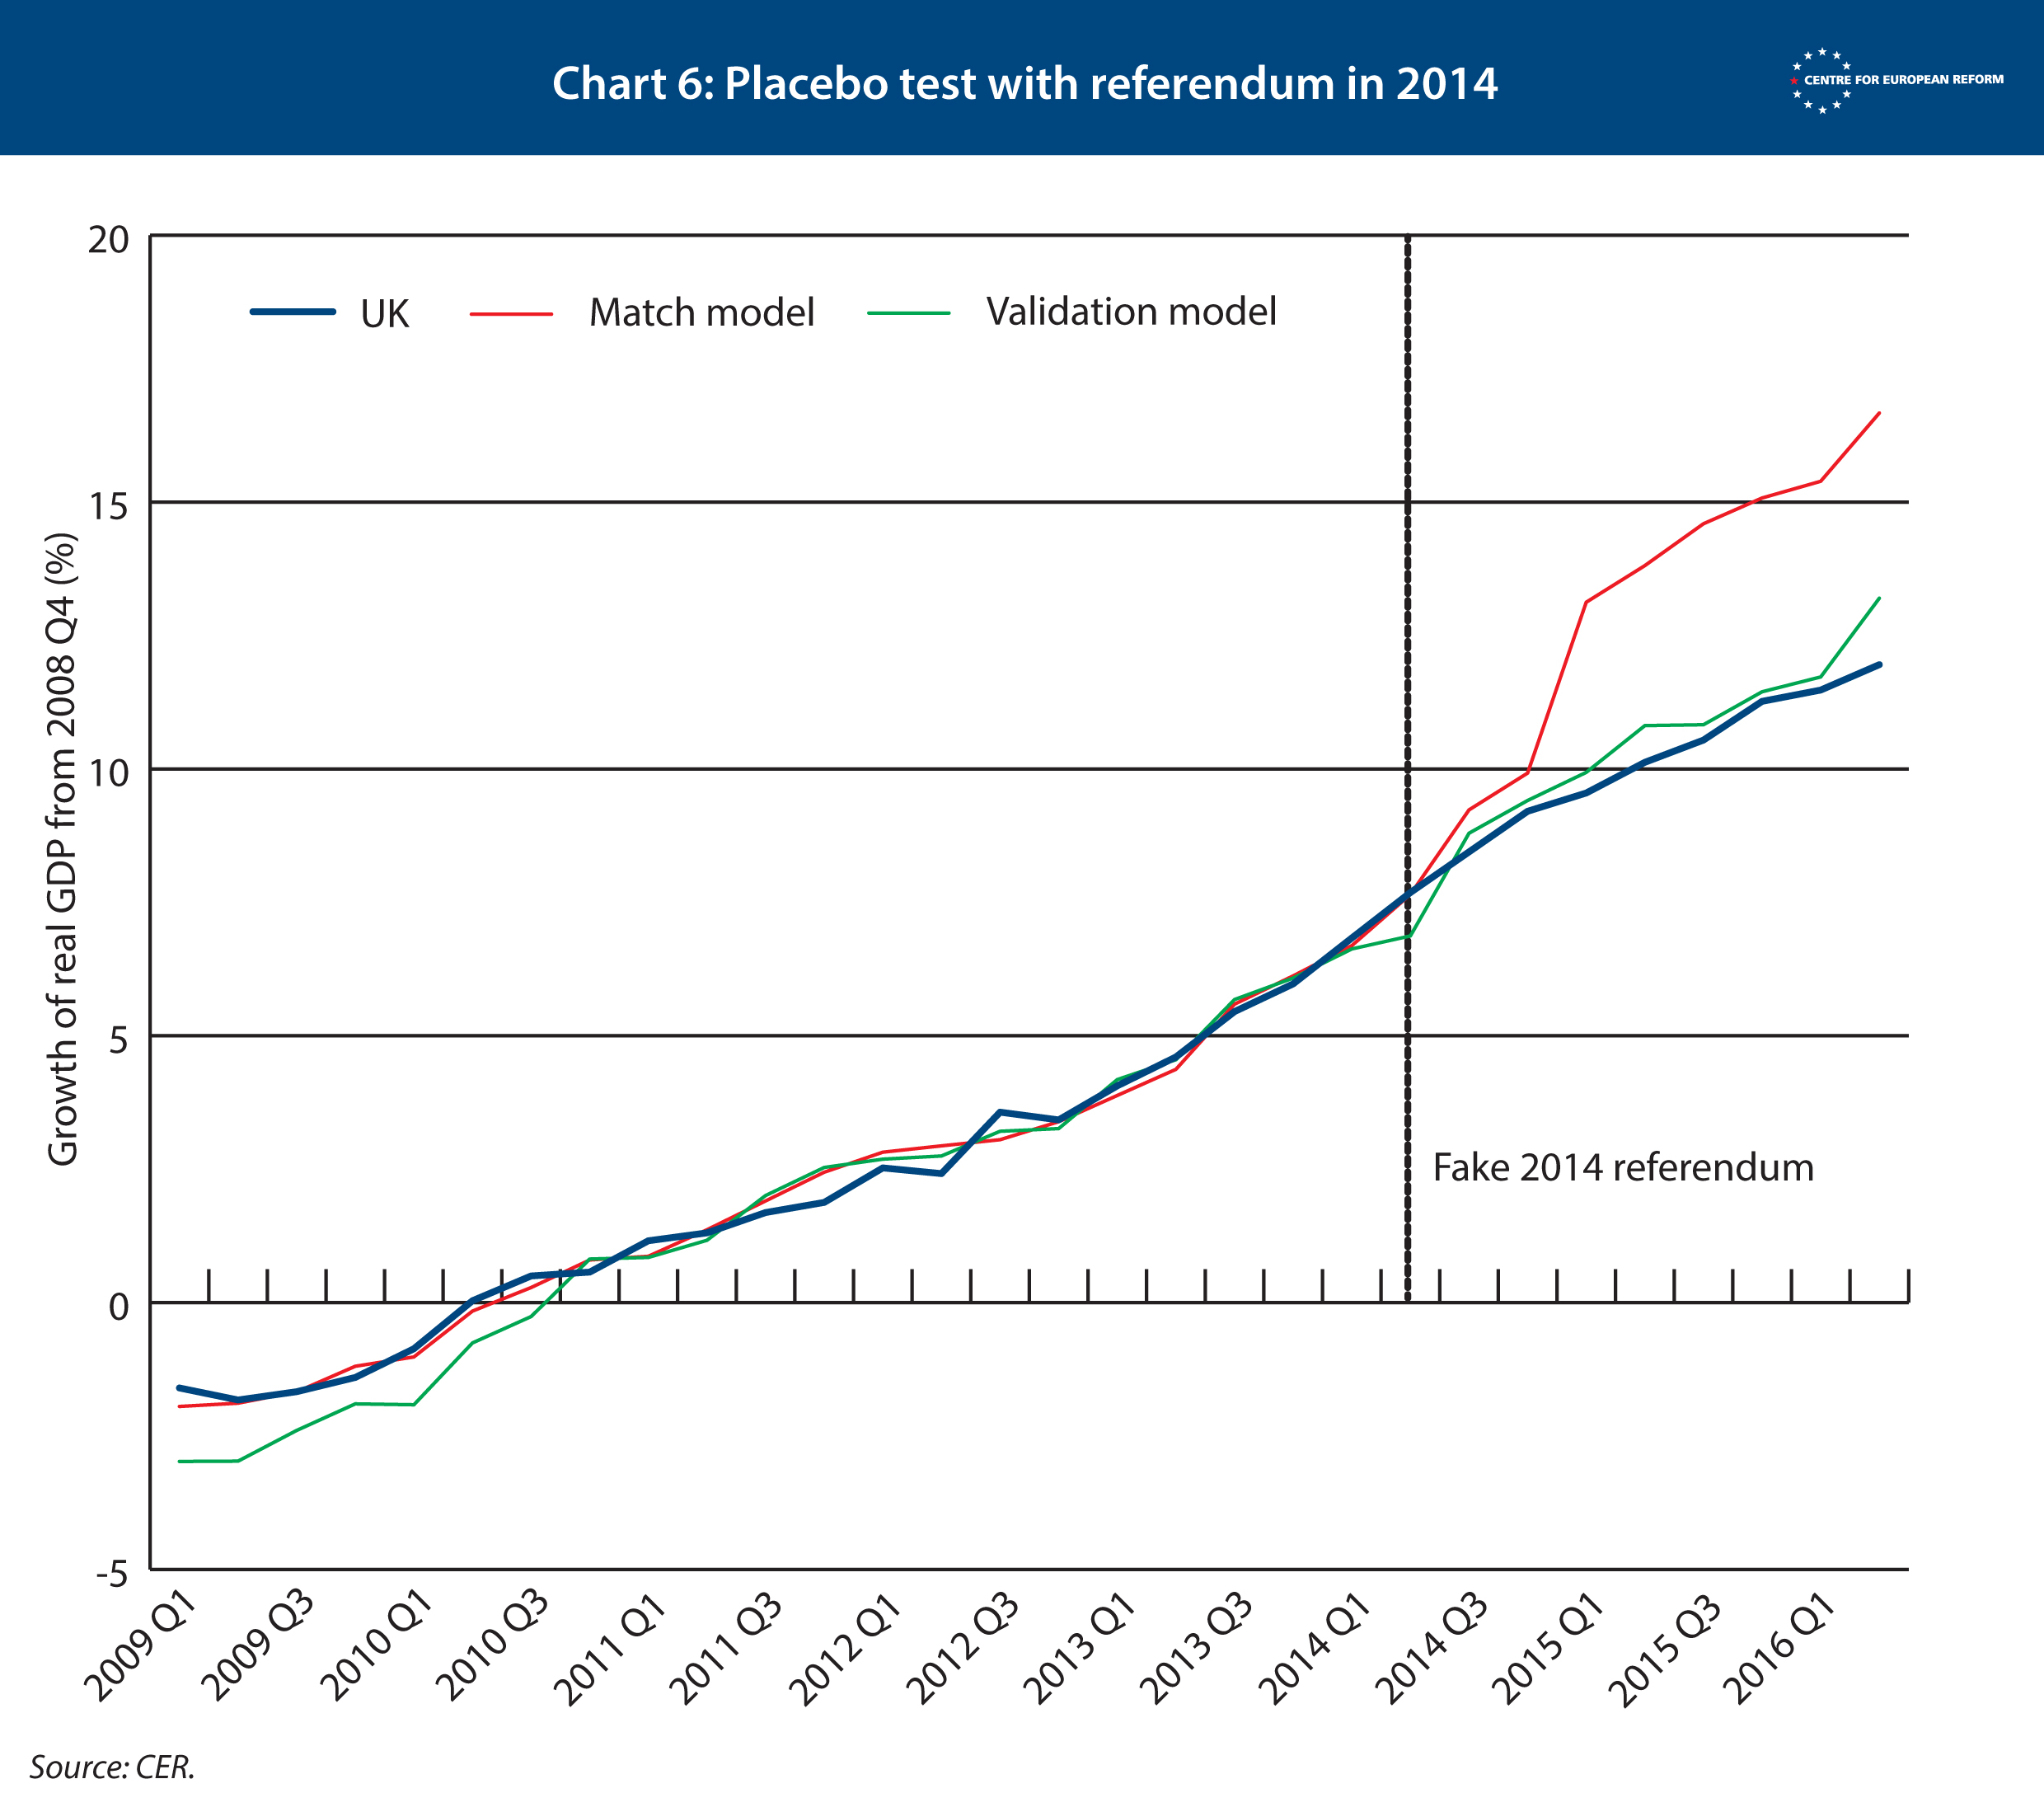
However, the match model performed poorly in our placebo test (see Chart 3). When we pushed the referendum back to 2014, it failed to predict the path of UK GDP thereafter. The validation model performed much better.
As a final test, we checked to see whether the validation model was ‘robust’ (see Chart 3 above). If one of the countries that made up the doppelgänger were removed from the underlying data, would the model still produce a similar estimate? The answer is yes, so we selected this model. It was most robust, had most predictive power, and provided a doppelgänger whose underlying economic structure was close to that of the UK. The table below shows that the model created a synthetic UK whose economic structure is similar to Britain’s.
John Springford is deputy director of the Centre for European Reform.
Add new comment