
The cost of Brexit, January 2021: The end of transition edition
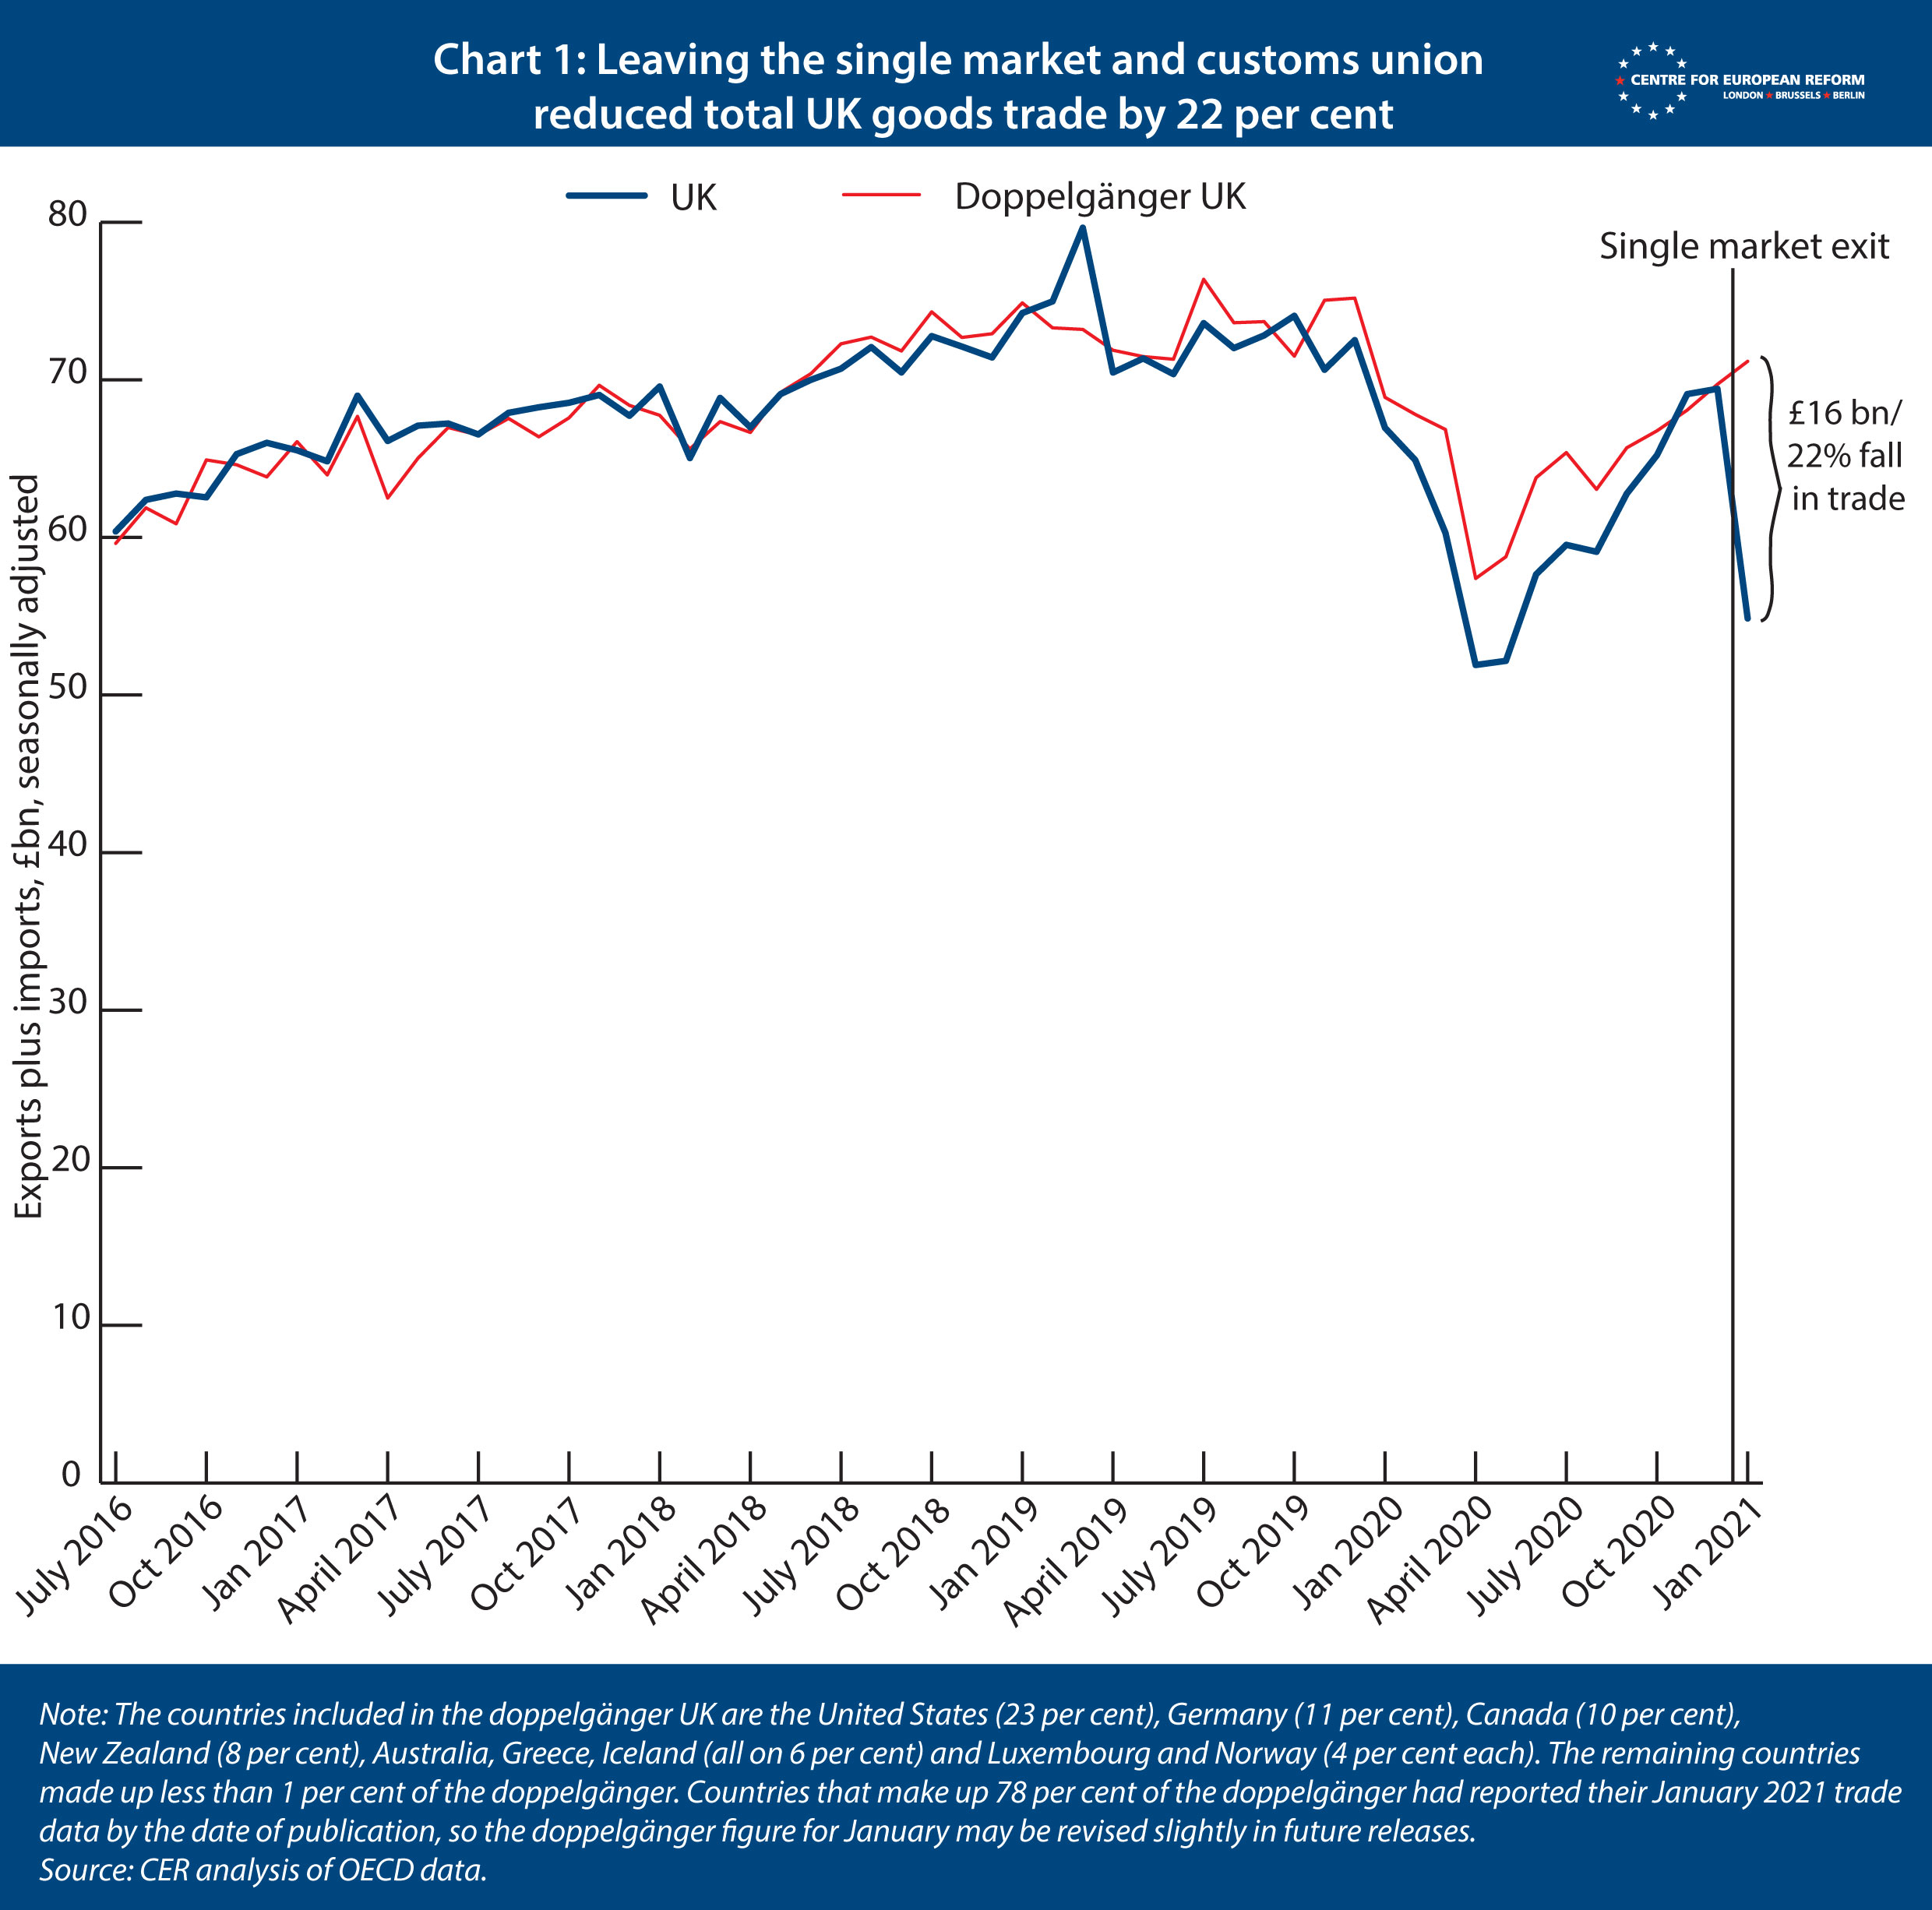
New analysis by the Centre for European Reform finds that leaving the EU’s single market and customs union led total UK goods trade to fall by 22 per cent, relative to a modelled Britain that remained within the single market and customs union. This figure will improve in future months as businesses adapt to the new arrangements. But January’s trade losses are on top of our other estimate, which shows that Brexit had already led to a 10 per cent reduction in total UK goods trade between the referendum in 2016 and the end of the transition period, which finished on 31st December 2020.
To estimate the effect of the UK leaving the single market and customs union in January, we use trade data from other advanced economies to create a ‘doppelgänger UK’. This method is similar to the one we previously used to estimate the cost of Brexit after the referendum (but which focused on GDP rather than trade, and adapted a model put together by Benjamin Born and colleagues). Simply put, the method works as follows. An algorithm chooses – from a ‘donor pool’ of 22 advanced economies – a selection of countries with economic characteristics that most closely matched those of the UK over the last decade. It does so by finding the countries that, when combined, create a doppelgänger UK with goods trade that has the smallest possible difference from the real UK data until December 2019, before the pandemic struck. By comparing the UK’s goods trade performance from January 2021 to that of the doppelgänger, we can assess how damaging leaving the single market has been to Britain’s trade, while also correcting for the effects of the pandemic. (A fuller explanation can be found in the appendix.)
Chart 1 shows the UK’s trade was £16 billion, or 22 per cent, lower than the doppelgänger in January. This is the first month’s trade data available after Britain left the Brexit transition period, and there were teething troubles as hauliers stayed away from Britain’s ports in order to avoid congestion, and some of those who did make the journey carried incorrect forms with them or failed to follow other procedures. Stockpiling before Christmas will also have reduced trade in January. Britain’s Office of National Statistics has (unhelpfully) changed the way it measures goods trade, which may artificially reduce trade in January and inflate it in February (this effect will be one-off, the ONS says). Trade flows have been improving since, according to the British government, and future updates of our model will determine the extent to which trade is permanently lower as a result of leaving the single market.
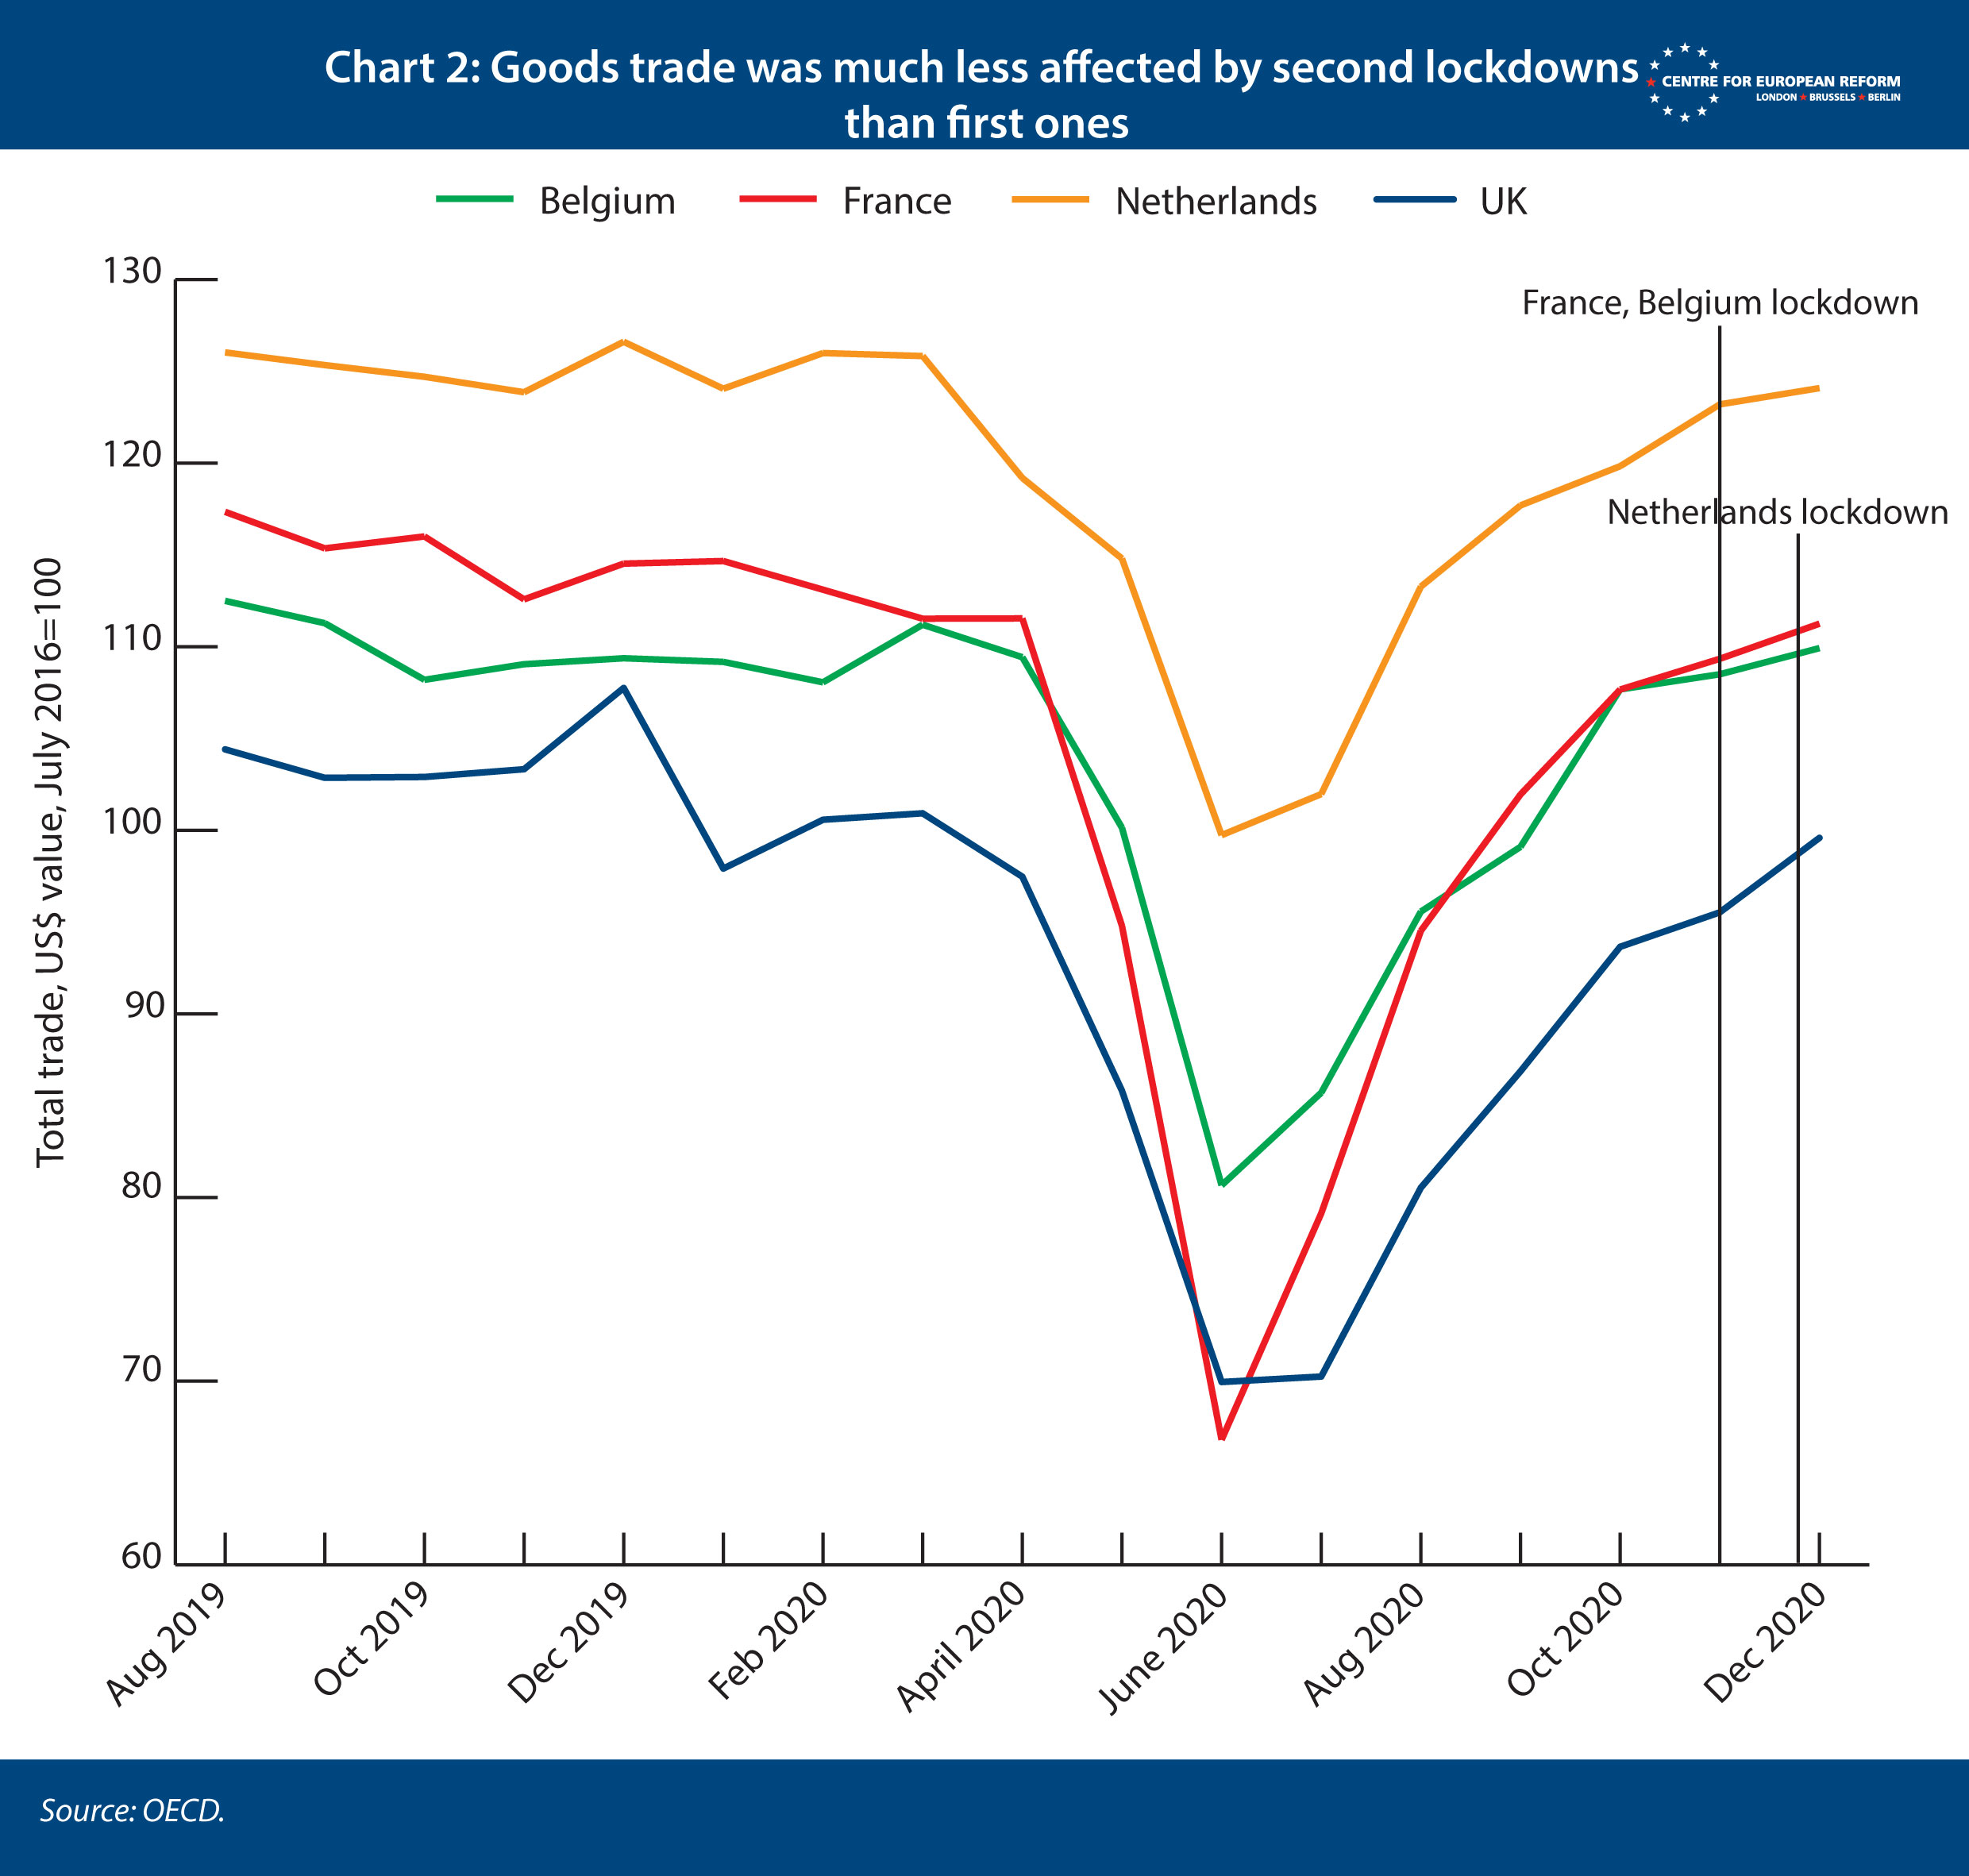
An advantage of using goods trade data, as opposed to GDP or services trade, is that in the UK and other OECD countries goods trade had returned to its pre-pandemic level by the end of 2020, despite the new waves of the virus that began in the autumn of 2020. France, Belgium and the Netherlands imposed second national lockdowns from November 2020, but restrictions did not reduce goods trade in the same way they had in the first lockdown (Chart 2). Few countries closed down manufacturing plants the second time around because they were found to play a minor role in transmission. We can therefore be confident that Britain’s lockdown in January is not significantly skewing our estimate. Adjusting for the pandemic is more difficult with GDP data, which includes services activity that is more heavily affected by lockdowns. If the UK’s doppelgänger included countries that had lighter lockdowns, its superior GDP performance would be due to the pandemic, not Brexit.
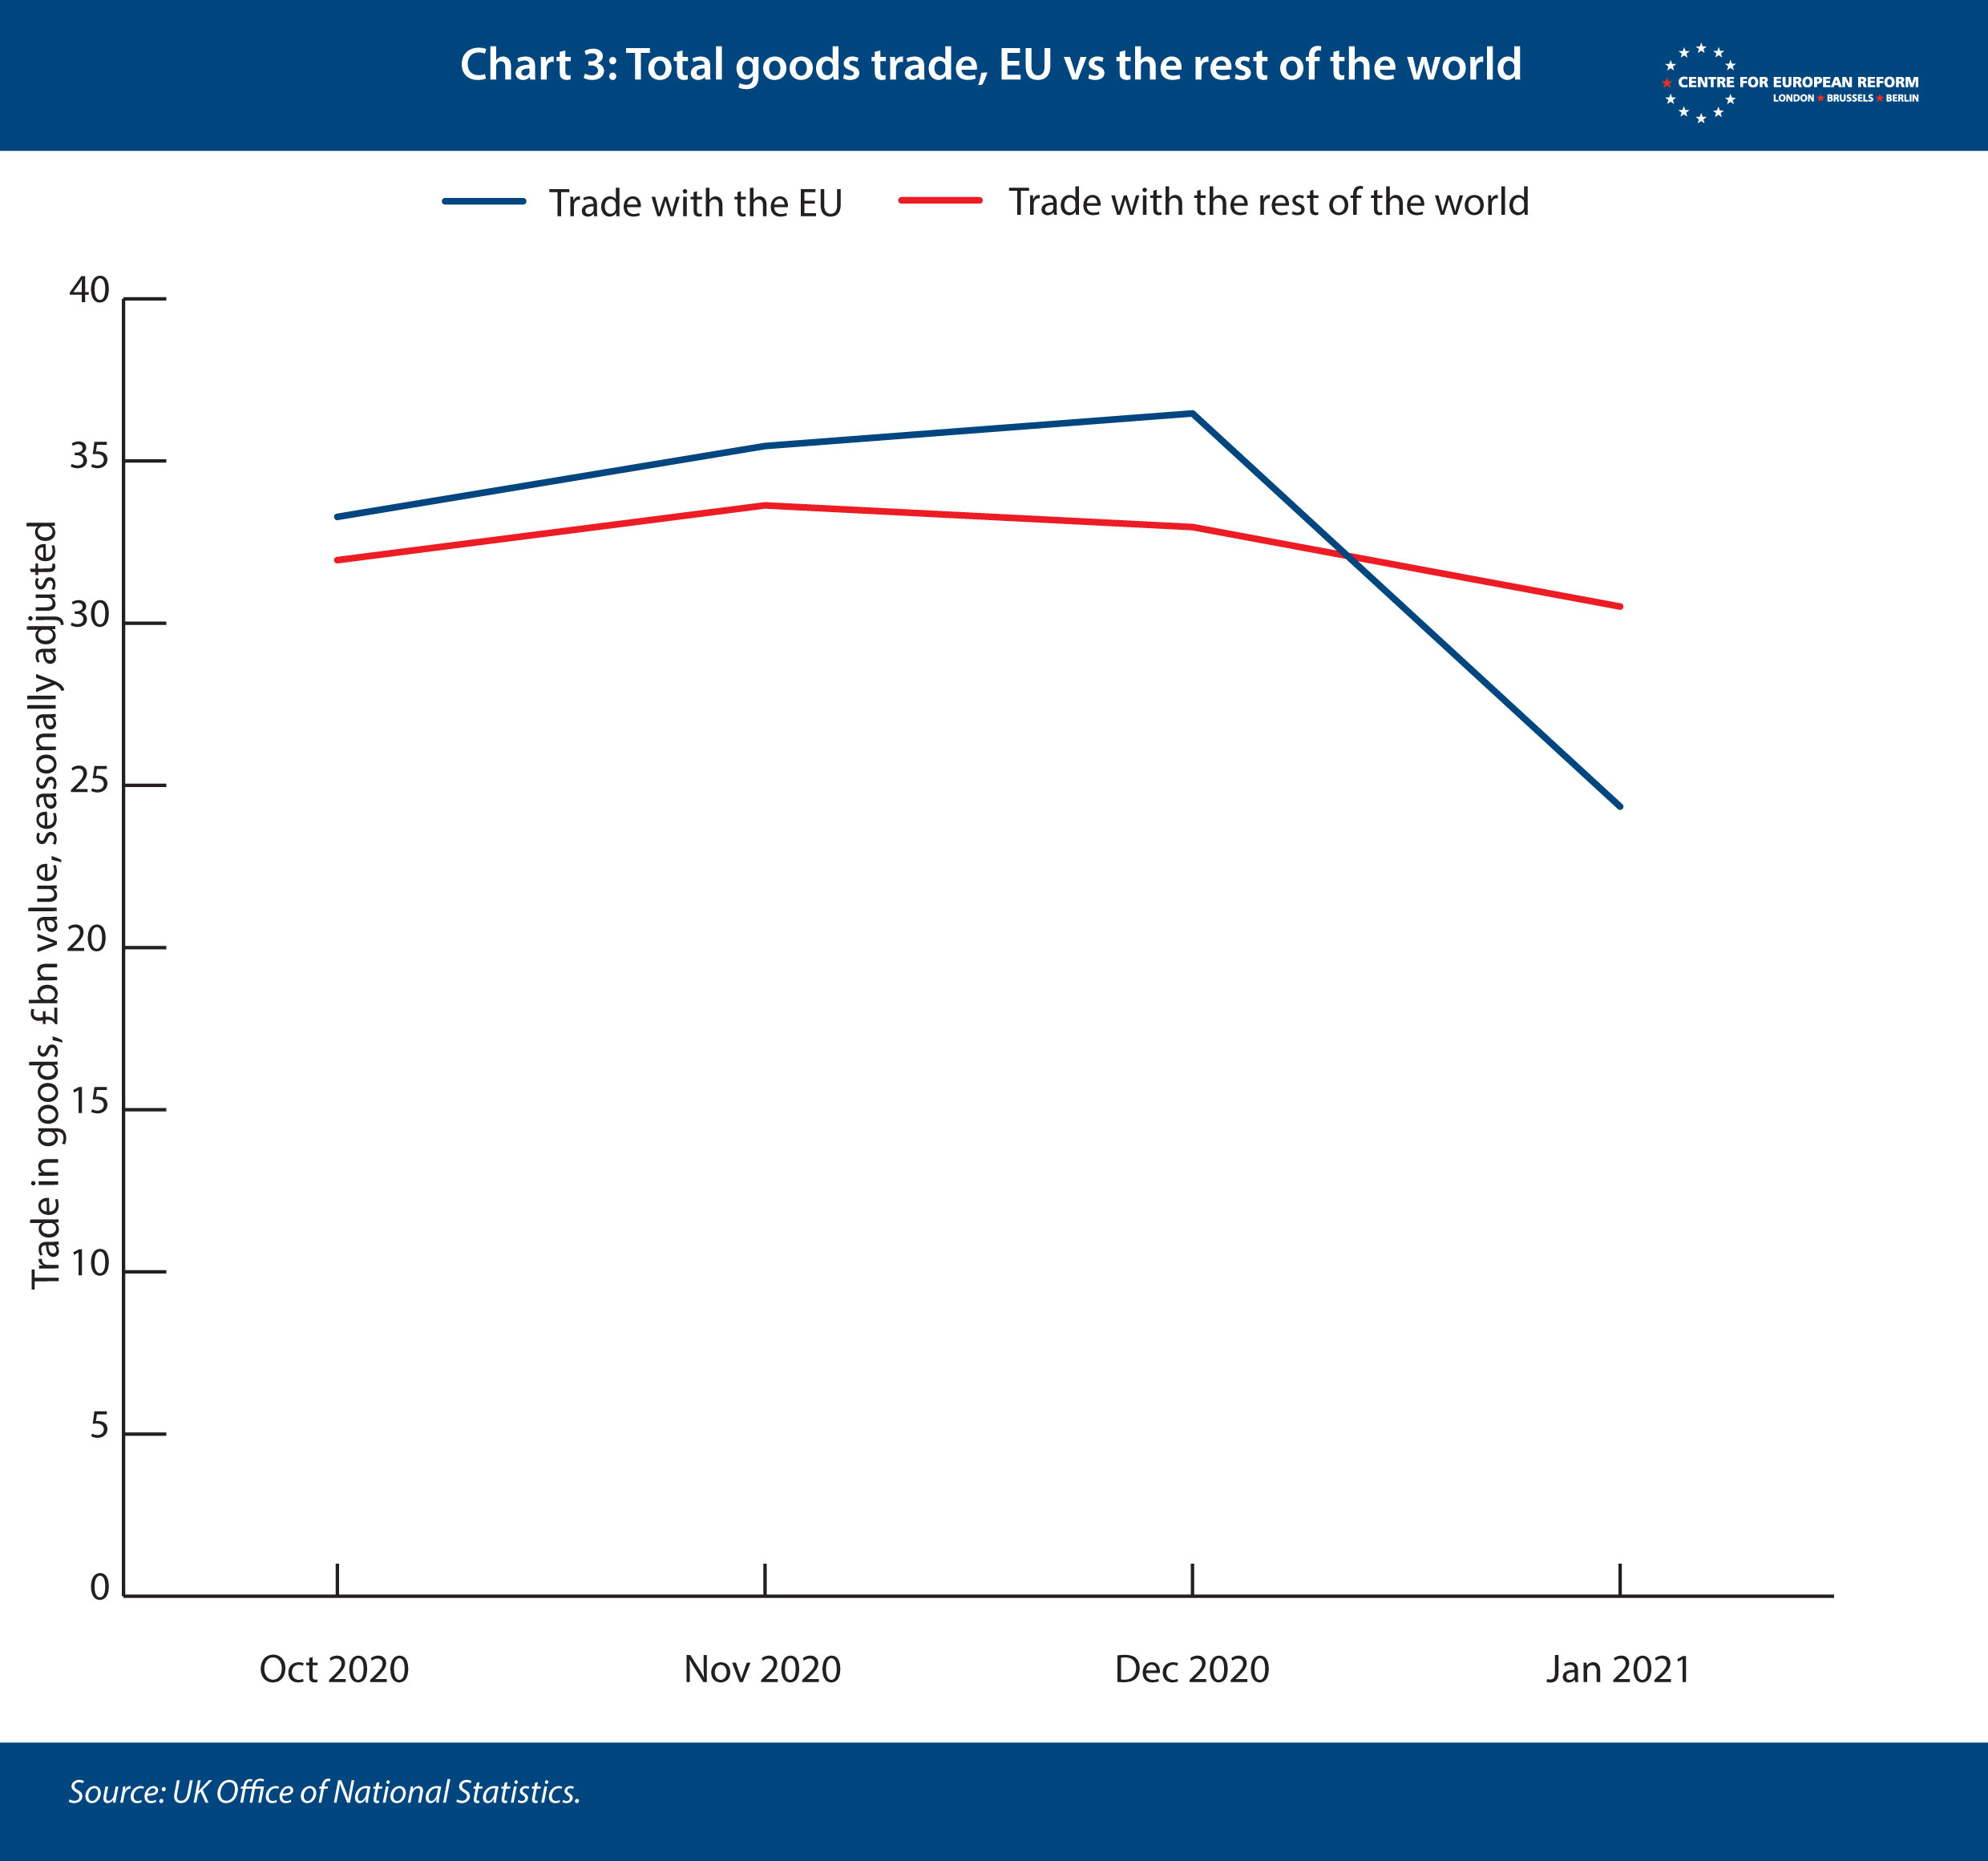
We can further identify whether the UK’s lockdown had an effect on the figures by comparing January’s trade with the EU and trade with the rest of the world (Chart 3). If the lockdown was responsible for the fall in goods trade, as opposed to Brexit, we should see both trade with the EU and the rest of the world fall back. If Brexit is responsible, EU trade will be hit. We see that most of the fall in trade is with the EU.
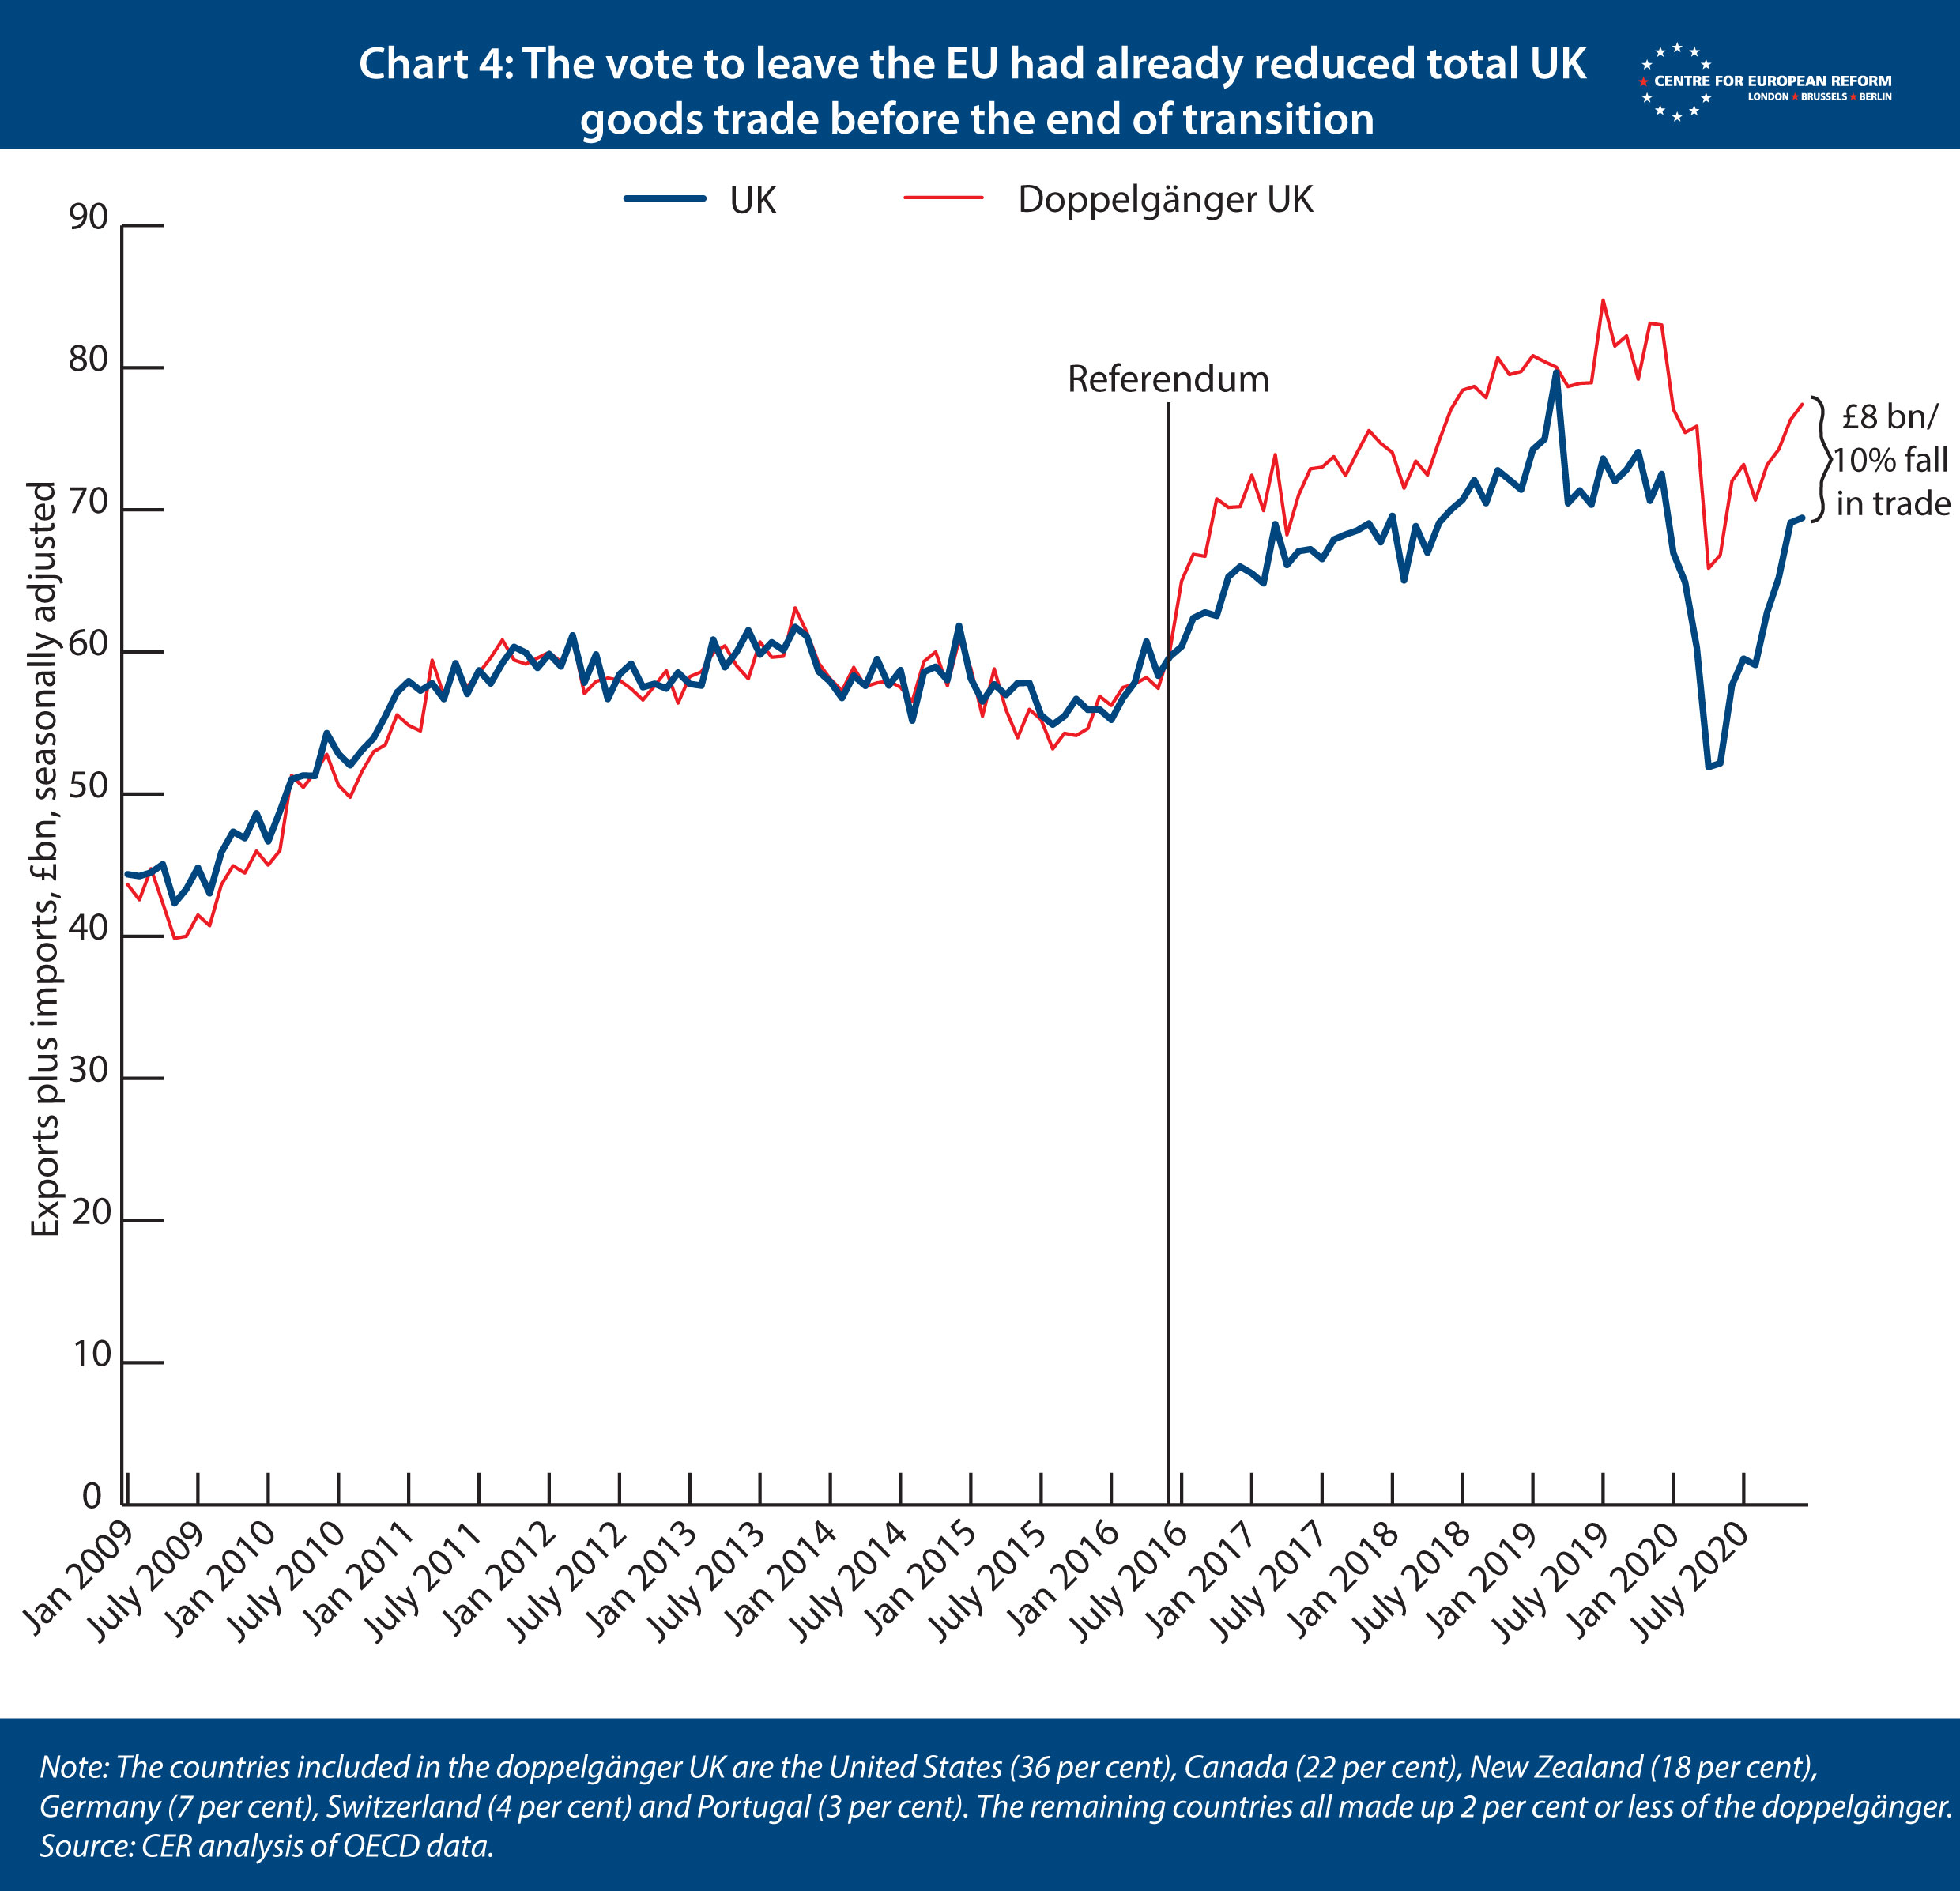
The January hit comes on top of a smaller loss of trade since the vote to leave the EU in June 2016. We have put together a separate model to estimate the trade effects of impending Brexit, after the referendum but before Britain left the single market and customs union. Again, we create a UK doppelgänger from the same 22 advanced economies, but we start comparing Britain against the doppelgänger from June 2016 rather than January 2021 (Chart 4). In this model, the vote to leave the EU reduced the UK’s monthly total trade by £8 billion, or 10 per cent, by December 2020, the last month of the country’s single market and customs union membership.
We can start to infer how accurate the forecasts for the impact of Brexit were by comparing them to our results. Our 2014 gravity model for goods trade found that UK trade with the EU was 55 per cent higher as a result of its EU membership. Since trade with the EU is 50 per cent of total UK goods trade, the model suggests that leaving the single market and customs union would reduce total trade by 18 per cent. That is smaller than the hit to trade we have estimated here: over time, we expect that Britain’s trade will recover, and get closer to that estimate.
Thomas Sampson of the London School of Economics and colleagues at UK in a Changing Europe forecast in 2019 that Boris Johnson’s deal would reduce UK trade by 13 per cent, and that would result in a fall in national income per capita of 2.5 per cent (only including the efficiency losses from lost trade: when the impact on productivity was also taken into account, the cost grew to 6.4 per cent). They forecast these declines to take place over a decade.
Time – and our models – will tell whether most of the reduction in goods trade occurred before or after January 1st, and whether we will see a further reduction in living standards, compared to a UK that remained within the single market and customs union, in the years ahead.
A discussion of the methods we have used to construct the doppelgänger continues in the appendix below. Interested readers can follow the links for the input data for our new models, the Stata code for model 1 and model 2.
Appendix
To create our UK doppelgänger, we trained a ‘synthetic counterfactual’ algorithm on 22 OECD countries that are as similar as possible to the UK, as measured by total trade in goods, investment as a share of GDP, the average years of schooling of the adult population, the share of industrial production in gross value added, the inflation rate, the share of trade to GDP, and GDP per capita. This ensures that the algorithm does not, for example, pick countries that had weak growth after the financial crisis, matching that of the UK, but which have a faster structural growth rate because they are less developed. If these countries were selected for their moderate growth to 2016, but then they grew more rapidly after the referendum for reasons unrelated to Brexit, then the doppelgänger UK would be biased upwards and the cost of Brexit artificially exaggerated.
But this approach can still lead to problems. We discontinued our previous model, which estimated the effect of the vote to leave on GDP, after the second quarter of 2019. That was because over time the countries that were included in the doppelgänger model were subject to other economic shocks that had nothing to do with Brexit.
In our new trade-focused models we have taken steps to iron out these issues. We combined our method with that of two academics, Thiemo Fetzer and Shizhuo Wang, who used a similar ‘synthetical counterfactual’ approach to estimate the cost of Brexit for the regions of the UK. Because they were using regional data, Fetzer and Wang did not have access to the range of predictors that we use to ensure that countries that make up the doppelgänger UK have similar economic structures. There is no data on the average years of schooling of populations or the trade-GDP ratios at a regional level across Europe and the US, for example.
Instead they asked the algorithm to find the European regions and US states that, when combined, most closely resembled, for example, the English county of Kent. But to ensure that a region of Hungary, a country with a faster structural growth rate than Britain’s because it is less developed, did not dominate the doppelgänger Kent and bias it upwards, Fetzer and Wang repeatedly ran the algorithm and randomly dropped regions from the ‘donor pool’ – the full set of regions from which the algorithm selects those that most resemble that region of interest. Fetzer and Wang dropped regions to create donor pools that contained a random set of 5, 10, 15, 20 … 30 regions. The algorithm selected the regions that most resembled Kent from those constrained donor pools. They then took the average of the doppelgängers that this repeated exercise produced.
This procedure ensured that their model was not ‘overfitted’, meaning that it was not matching on particular regions just because their economies happened to perform similarly to Kent but for reasons unrelated to Brexit. We followed their procedure in our national-level model, to ensure that the UK’s trade performance is not too dependent on the US, Canada or Germany – or indeed other countries that closely matched the UK, either up to the referendum, or up to the single market exit in January 2021.
We therefore combine these approaches, using a range of predictors but randomly dropping countries in our two models – model 1, which measures the hit to trade from leaving the single market and customs union from January 2021, and model 2, on the impact on trade of the vote to leave in June 2016 until December 2020.
Model 1. In the first period, between January 2009 and June 2016, we train the algorithm on total goods trade, seasonally adjusted and measured in current US dollars, as well as the other predictors mentioned above. In the second period, between June 2016 and December 2020, we program the algorithm to minimise the root mean squared prediction error, which means that the algorithm focuses on total trade and the other predictors fall away. This is why Canada and New Zealand are prominent in the doppelgänger: their poor trade performance, when combined with the US and Germany, matched that of the UK after 2016. The oil price fell, curbing the value of Canada’s trade, and New Zealand is a closed economy for its size, with slow growth in trade because it is geographically distant from world markets. We stop the algorithm from finding matches in December 2019, in order to make it ignore the effects of the pandemic.
However, the oil price might recover, so in order to prevent Canada from skewing the results in the future, we repeatedly run the model on donor pools from which countries have been randomly dropped. We run the model on a donor pool of 5, 7, 9, 11, 13, 15, 18, 20 and 22 countries. That means that Canada appears in the donor pool, on average, 60 per cent of the time, and reduces the dependence of the algorithm on any one country. This is also true of the US: while the algorithm includes the US when it can, because it has a similar economic structure to the UK, the randomly smaller donor pools mean that it also only appears 60 per cent of the time. We then record the average doppelgänger from these repeated exercises.
This method allows us to strike a balance between:
- a doppelgänger that has similar overall economic characteristics to the UK, rather than simply having a similar trade performance in the period of interest
- a doppelgänger heavily skewed towards the US or Canada, and therefore susceptible to positive or negative economic changes in those countries that have nothing to do with Brexit.
Model 2. This model is the same other than the training and matching periods for the algorithm being different. Because we are interested in the effects of the referendum, the training and matching periods end in June 2016. We train the algorithm on the broader range of predictors, not just trade, between January 2009 and December 2011, to ensure that we include countries whose economic structure is similar to Britain’s. Then we match only on total trade between January 2012 and June 2016, the month of the referendum, to ensure that algorithm matches closely on our variable of interest.
We repeatedly run the algorithm on donor pools that have been randomly selected according to the procedure above, which has the effect of reducing but not eliminating the weight of the US in the doppelgänger.
Placebo tests
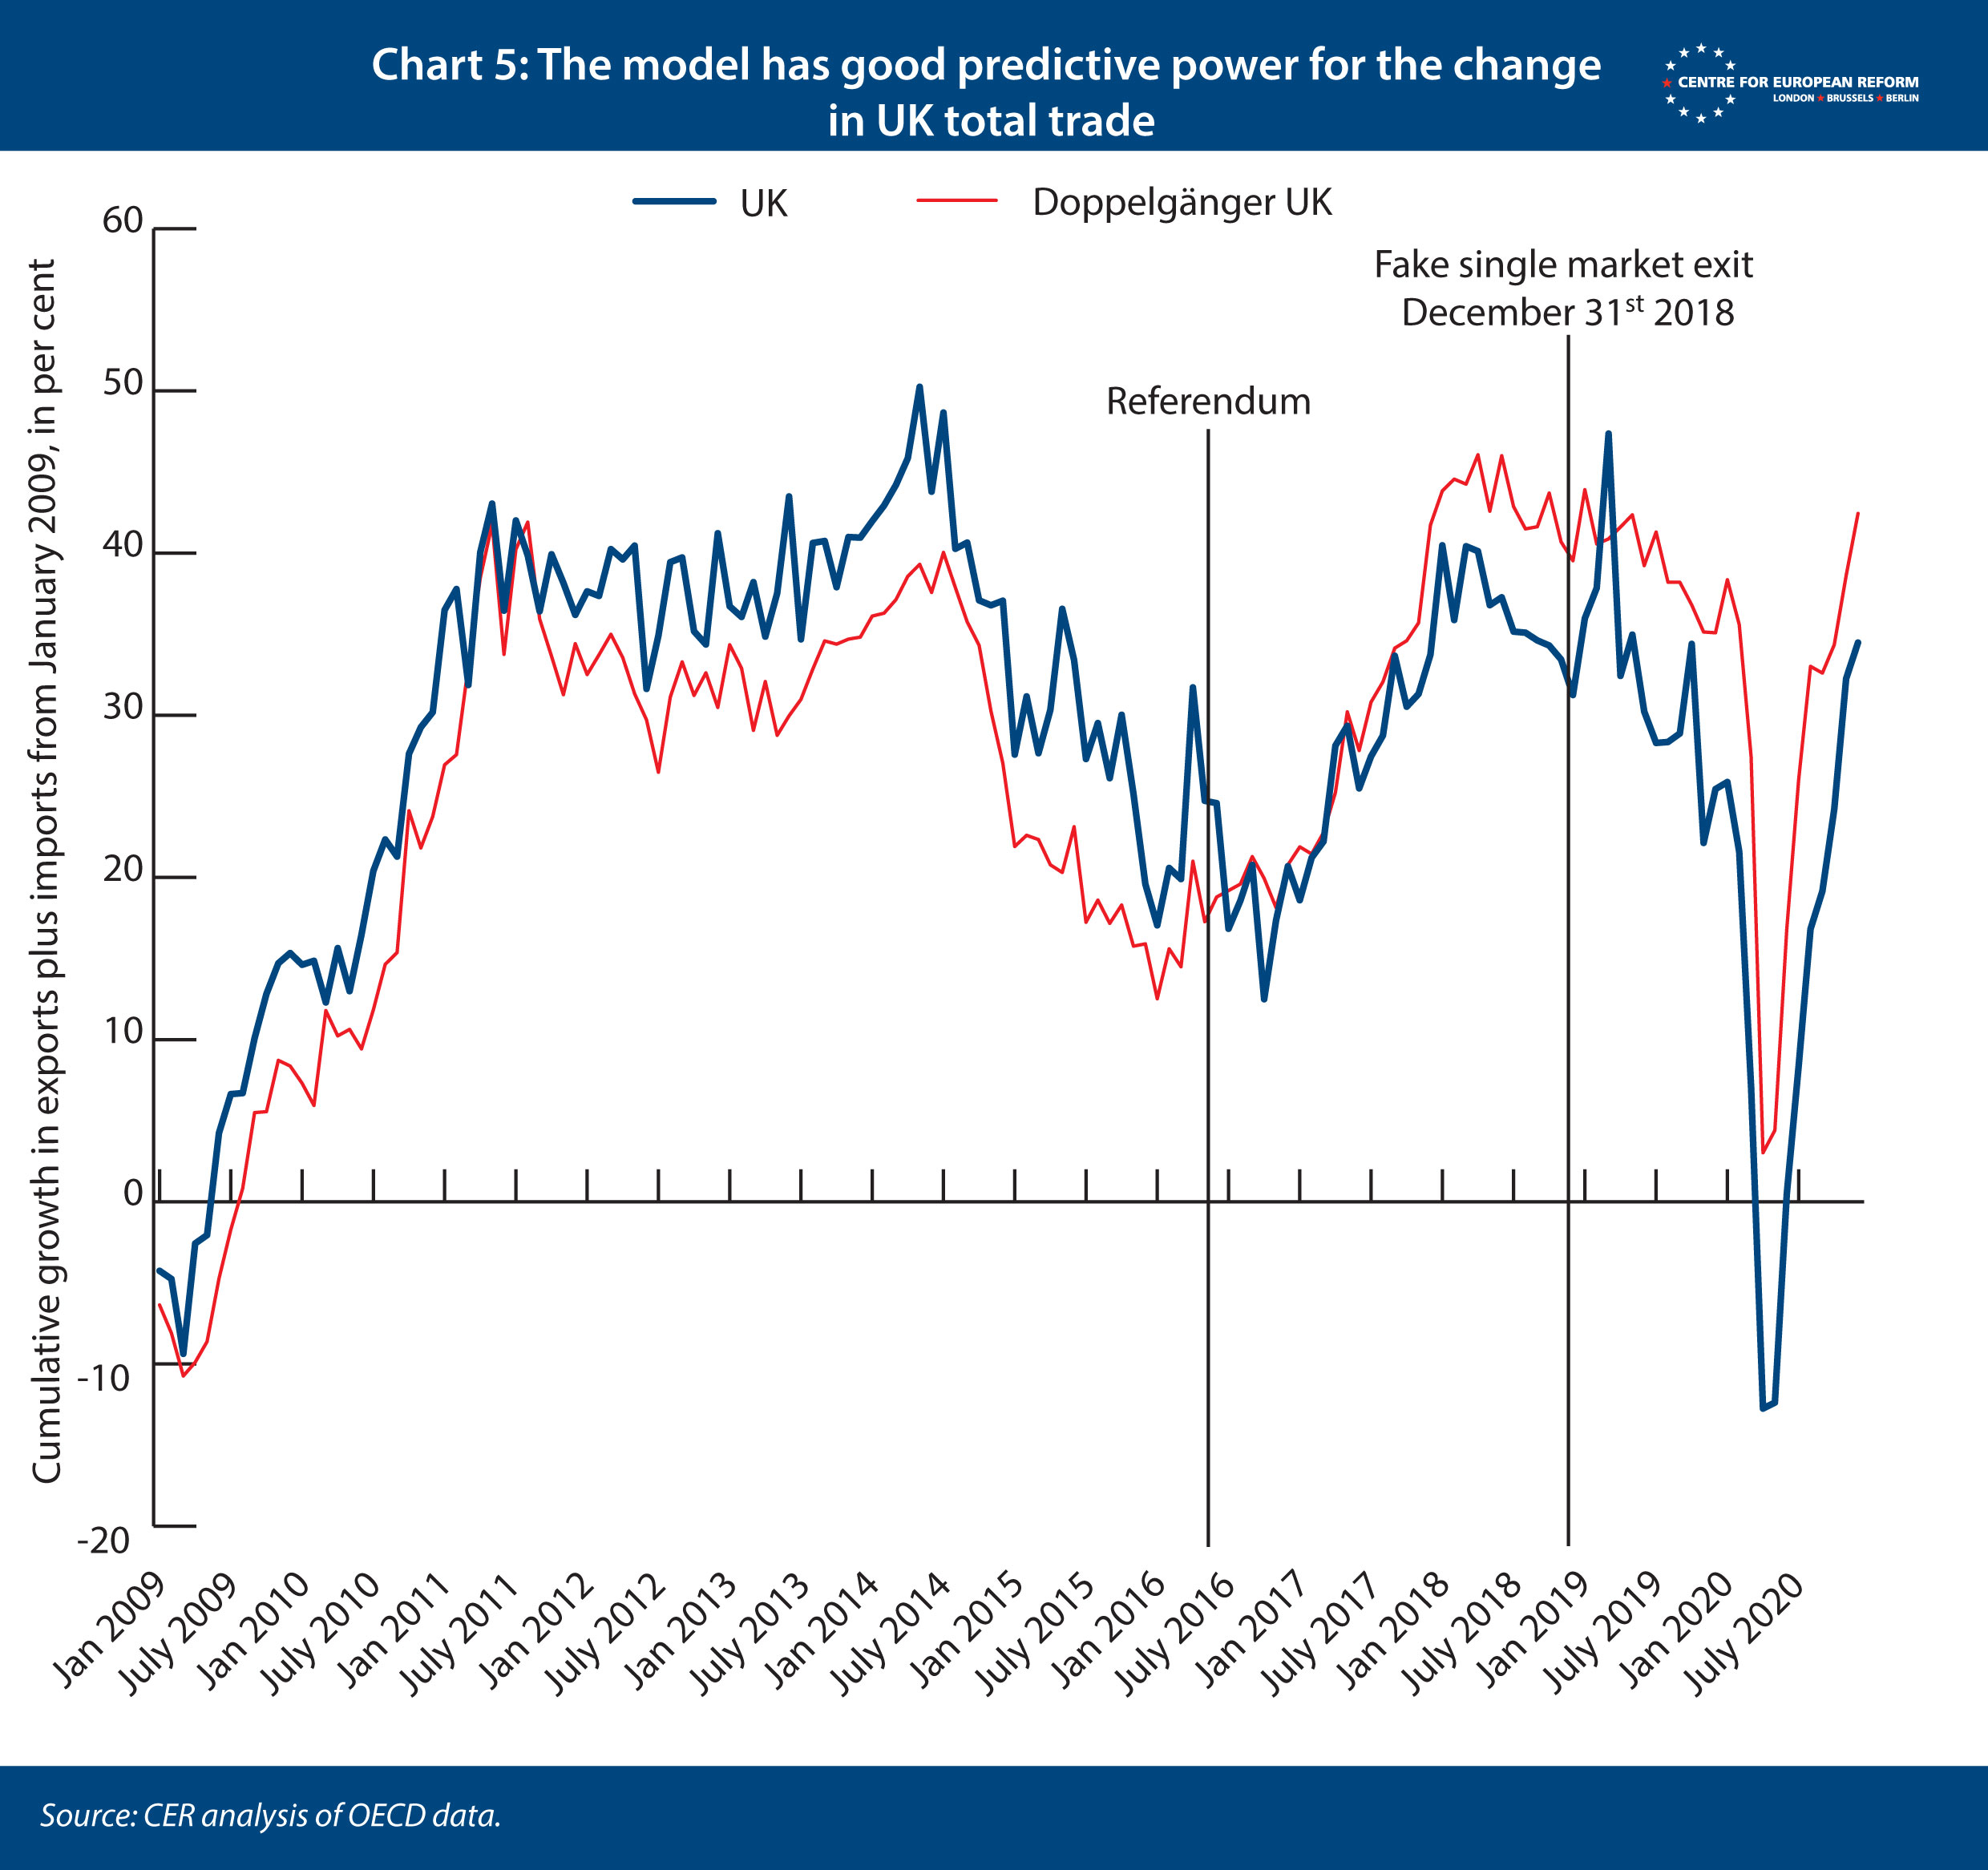
To test how robust these models are, we performed two ‘placebo’ tests, whereby we created fake referendums and single market exits, and saw how they affect the performance of the models. The doppelgänger should not react to these fake historical events if the models are robust. The first placebo test was on model 1. We moved the date of single market and customs union exit back to December 31st, 2018, as opposed to the same date in 2020 (Chart 5). We discovered that the algorithm found it more difficult to find a set of countries that matched the UK data, with the doppelgänger underperforming the UK up to the referendum, and then outperforming it afterwards. However, we did not see the doppelgänger diverging from the UK after the fake single market and customs union exit, suggesting that the model accurately predicted the change in the UK’s total trade after December 2018 (if it over-estimated the level).
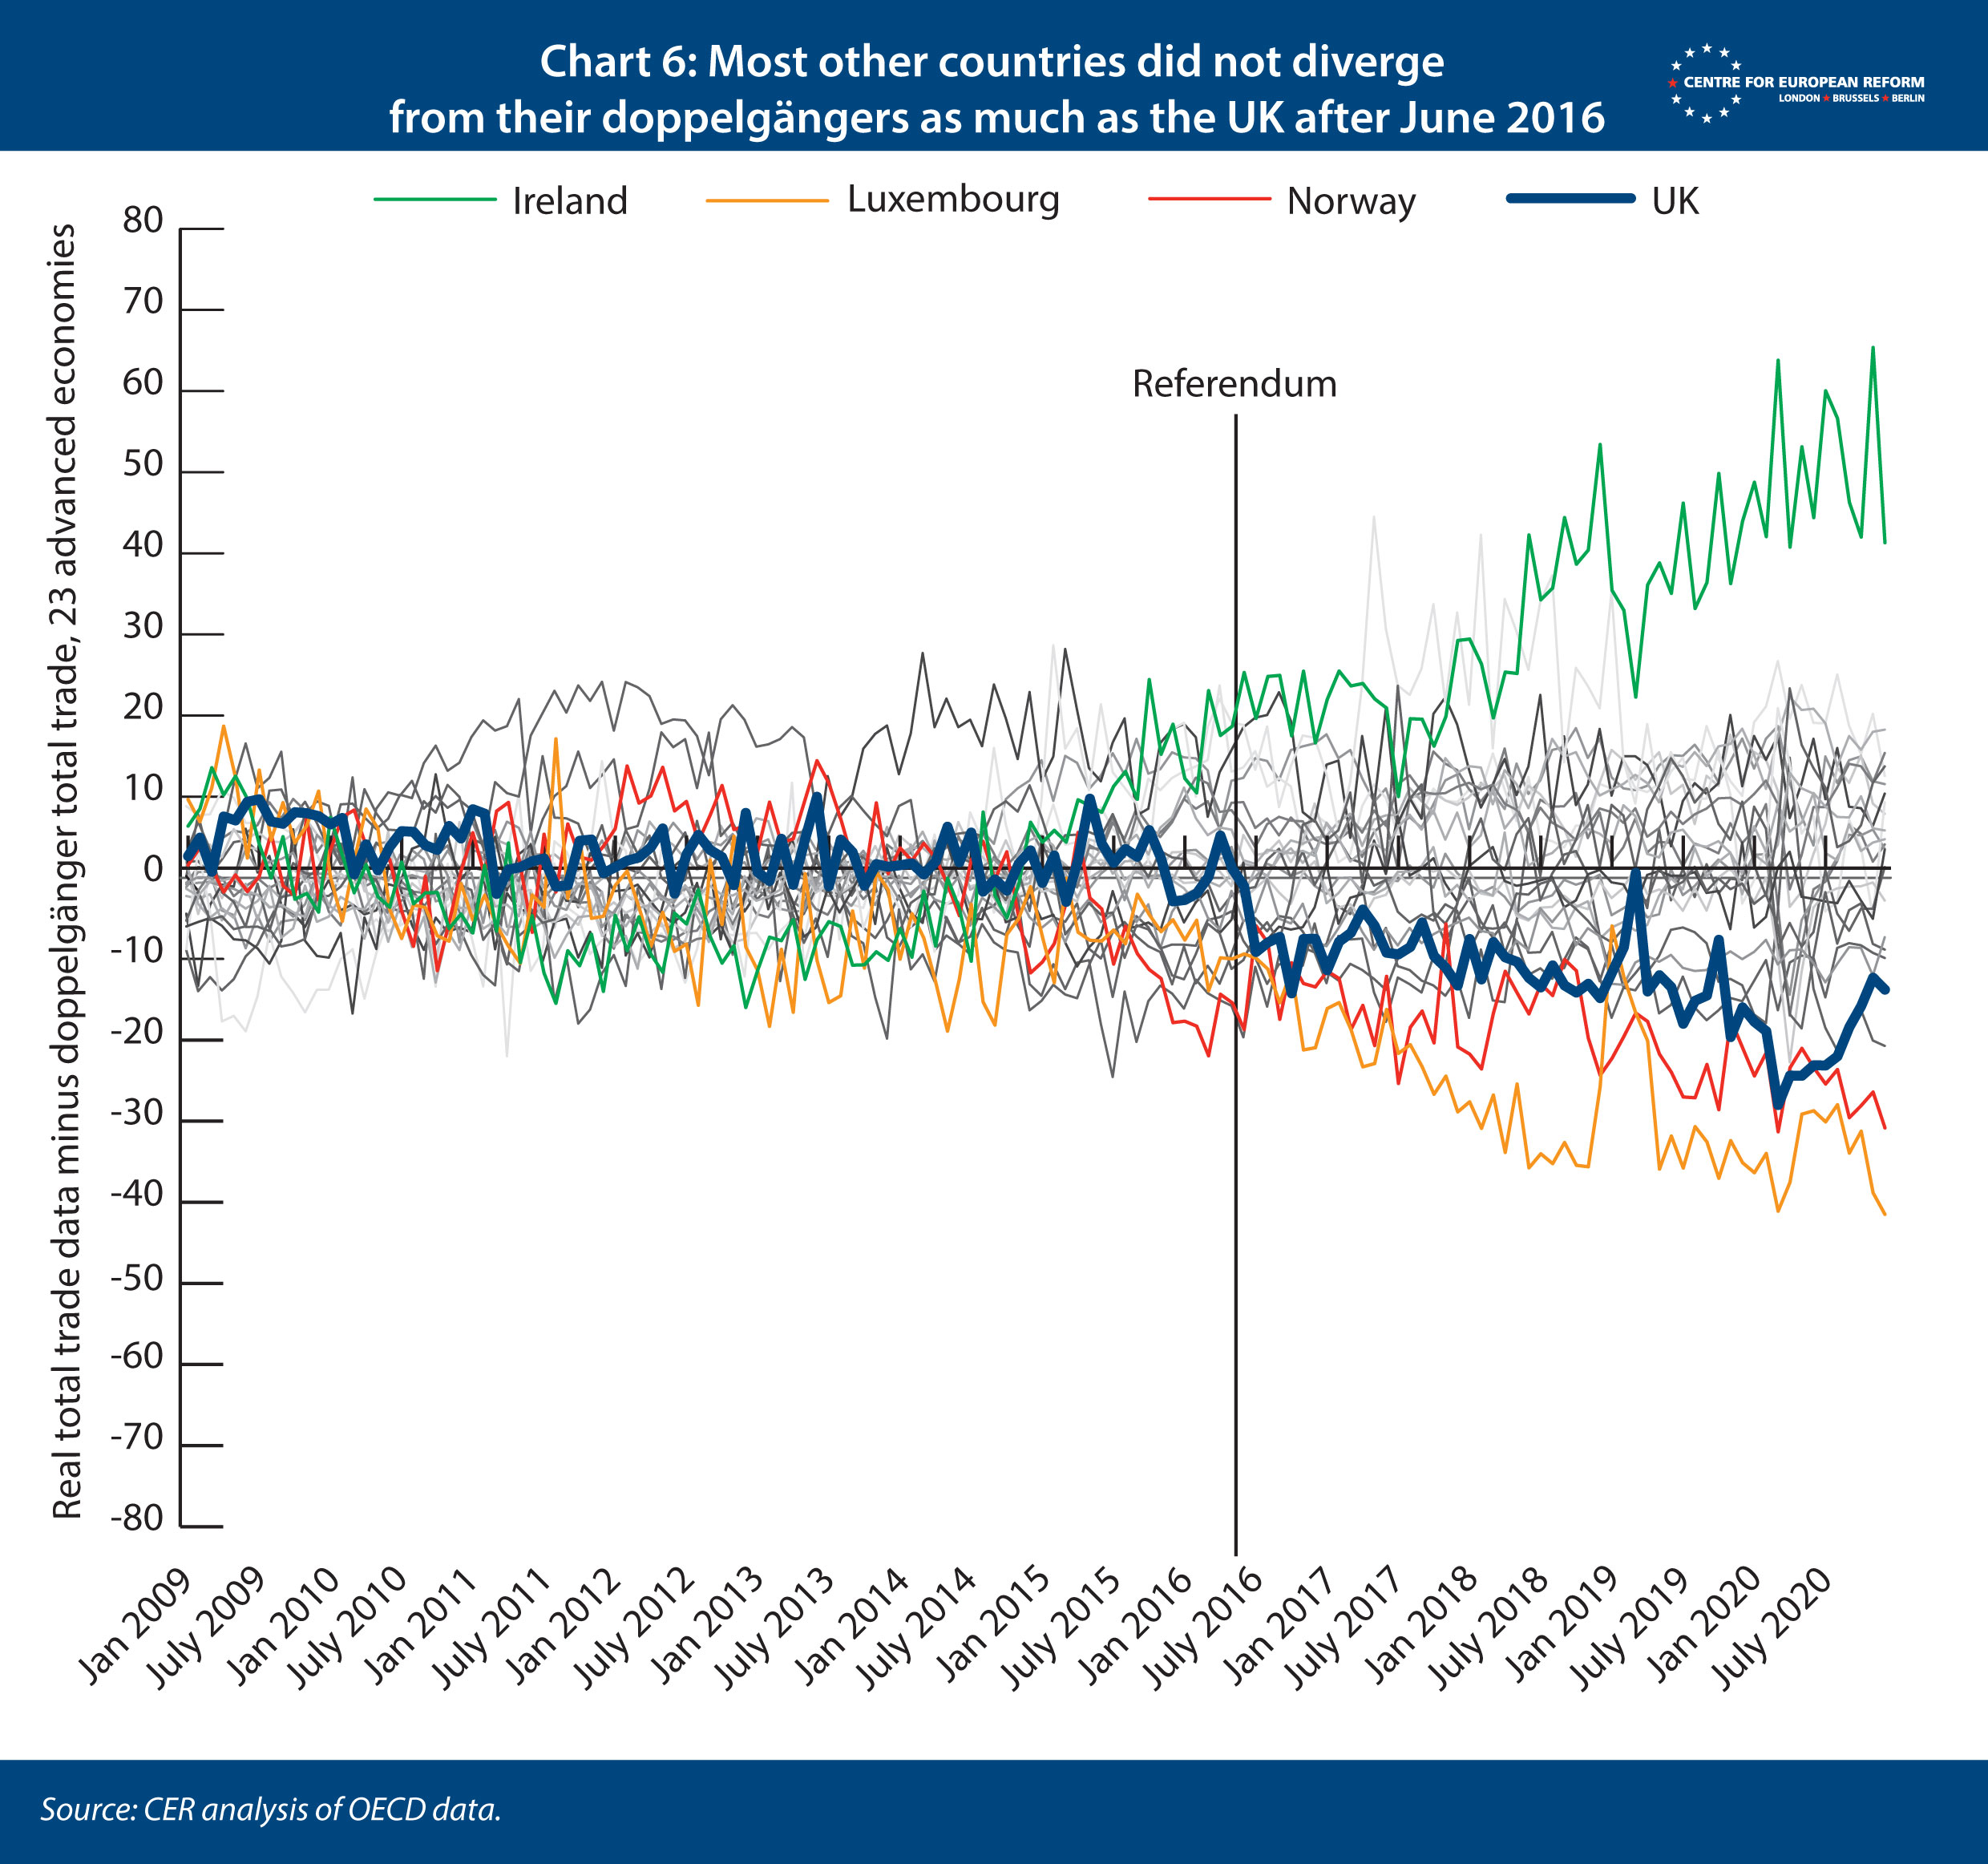
On the second model, which estimated the hit to trade between the referendum and the end of transition, we ran a different placebo test. Here, we wanted to know how our results for the UK compare to other countries, if they had (fake) referendums. This test reveals whether countries that had no referendum in 2016 also displayed changes in trade patterns from that year onwards, which would make us less confident that Brexit was driving the divergence between the UK and its doppelgänger after June 2016. We applied model 2 to each other country in our set of 22 in turn, as if the country in question had a referendum in June 2016. All other countries, including the UK, then formed the donor pool. Chart 6 shows the results of these 22 estimations – each of the 22 countries is represented by a grey line, while the outliers are coloured. If we discovered that other countries diverged from their doppelgängers from July 2016, just as the UK did, we could be less confident that our model was accurately estimating the cost of Brexit, and more concerned that something else happened after 2016 that made the growth rates of our 22 countries’ trade suddenly change.
The UK was one of the biggest underperformers after the referendum, which makes us confident that the Brexit referendum was the reason for the divergence between the doppelgänger and the real UK data. Luxembourg and Norway saw bigger declines in trade from 2015 – in Norway’s case because of the collapse in the oil price. By contrast, Ireland was the biggest overperformer from 2015, after a flurry of corporations moved their balance sheets to Ireland in order to avoid corporation tax, which had the effect of raising the value of exports that were booked in the country. Yet the doppelgängers of these countries diverged from their real data before their fake referendums took place. That also gives us confidence that Brexit was the reason for the UK’s poor performance.
John Springford is deputy director of the Centre for European Reform.
Add new comment