

Why Europe should not worry about US out-performance
The US has had stronger growth than Europe recently – but its out-performance is easily explainable. Instead of worrying about the US, Europe should focus on itself and avoid repeating past mistakes.
The consensus on Europe’s economy is increasingly morose, with the continent lagging the US growth rate. However, media coverage often suffers from a lack of rigorous thinking about how to compare the two economies. Europe’s economic performance is under-appreciated as a result. Whilst the US has grown considerably faster than the EU since 2010, US out-performance has been fuelled by three factors:
- The US has faster population growth and more favourable demographics.
- The US has become a net exporter of energy while Europe cannot meet all its energy demand with its scarce domestic energy sources, and consequently pays high prices for imports.
- The US has had both greater fiscal space to stimulate its economy and far greater willingness to use it.
Of these three advantages, the first is a structural trend which would take time for Europe to reverse, including by facilitating immigration, a politically sensitive issue. The second is a physical constraint which Europe is addressing by investing in alternatives to fossil fuels, though this too will take time. The third is political and could be remedied, if not fully resolved, if EU countries were willing to do so.
Yet despite these constraints, the European economy has overall performed admirably. Productivity growth has been solid on average, although it has varied widely across the EU.
How to compare economic performance
Using GDP as a measure for economic growth for a single country is straightforward. But it can be misleading to use it to compare economies for two reasons: shifts in exchange rates and differences in inflation between countries. A simple comparison using market exchange rates would indicate that the US economy is now 50 per cent larger than the EU economy, up from near parity in 2010. Yet most of that does not reflect differences in economic growth. Instead, it reflects the fact that in 2010 prices in the EU and the US were at similar levels, while by 2022, US prices were 47 per cent higher than in the EU. This change in price levels was driven by a stronger dollar and to a lesser extent higher US inflation, not by economic growth.
What matters for economic comparison is the real quantity of goods and services an economy can produce, not their price. GDP at purchasing-power parity (PPP) is the best way to compare how much economies produce, because it adjusts for differences in price levels. According to IMF data, by this measure the size of the EU-27 economy was 95.6 per cent of the US economy in 2022, only a small decline from 97.1 per cent in 2010.
Yet this kind of comparison understates US economic performance. Changes in PPP-adjusted GDP between the US and the EU reflect both faster real economic growth in the US and faster price growth in the US relative to Europe. In a PPP-comparison, the latter will to some extent compensate for the former.
PPP comparisons are therefore useful measures of relative economic size at a given point in time but are less useful to compare economic performance over time.
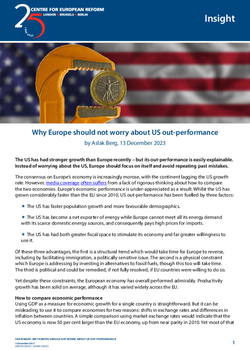
Instead of comparing economic size over time, it is therefore better to focus on differences in real economic growth between the US and the EU. This allows us to focus on underlying performance without the impact of currency fluctuations or the limitations of PPP calculations. As shown on Chart 1, cumulatively, the US has grown 8 per cent more than the EU since 2010. The US engineered stronger recoveries from both the 2008 global financial crisis (GFC) and the Covid pandemic, while the EU lost years of growth to the eurozone fiscal crisis. More than half of the growth gap between the EU and the US opened up between 2011 and 2013.
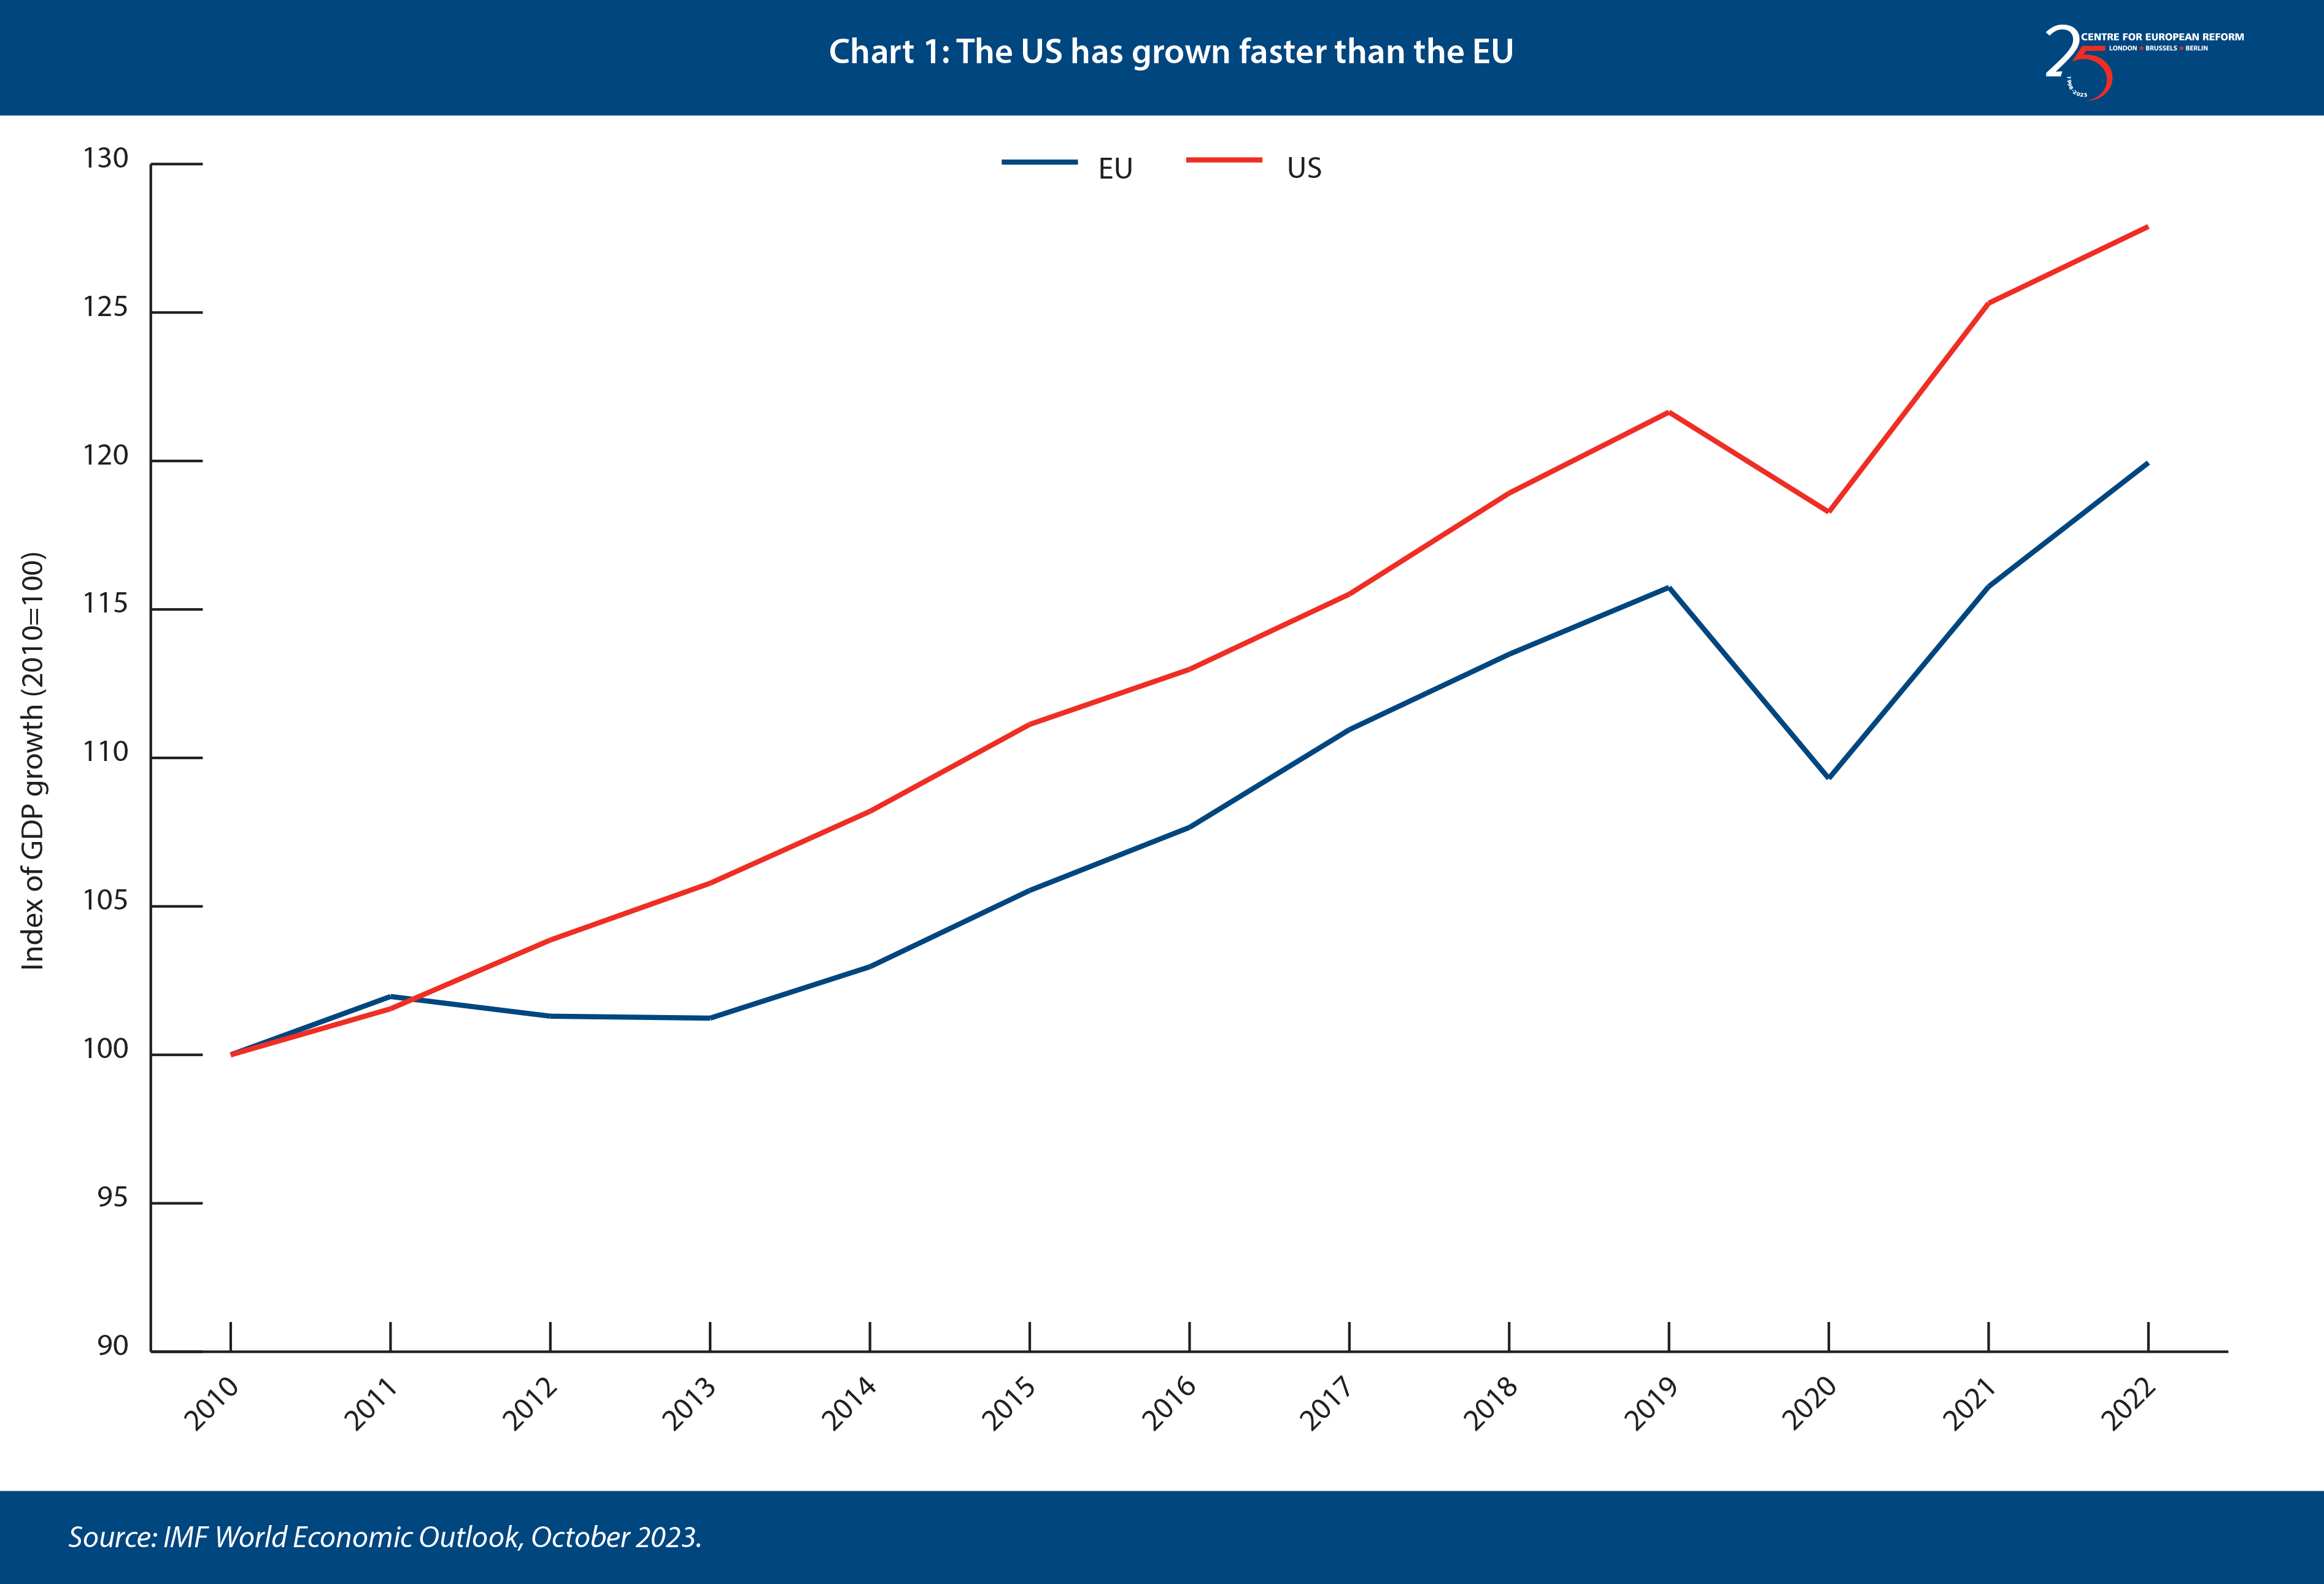
However, that is not the end of the story. The US has also had much faster population growth, so the difference in change in GDP per capita – a broad measure of living standards – between the US and EU is much smaller. Per capita GDP in the US has increased by 18.7 per cent since 2010, compared to 16.3 per cent in the EU. Except during the eurozone crisis, European growth has been respectable, if a bit slower than in the US.
However, there are significant differences in economic performance within Europe. The EU member-states’ average growth rate is pulled up by rapid catch-up growth in central and eastern European economies, as shown in Chart 2. For example, GDP per capita in Poland increased by over 50 per cent since 2010. The rapid growth of this region is a significant success for Europe, but the performance of the older EU members is much less encouraging. US per capita growth has been 50 per cent faster than that of the eurozone, which is dominated by older EU members, and four times faster than Europe’s lagging economies like Italy.
Explaining US out-performance
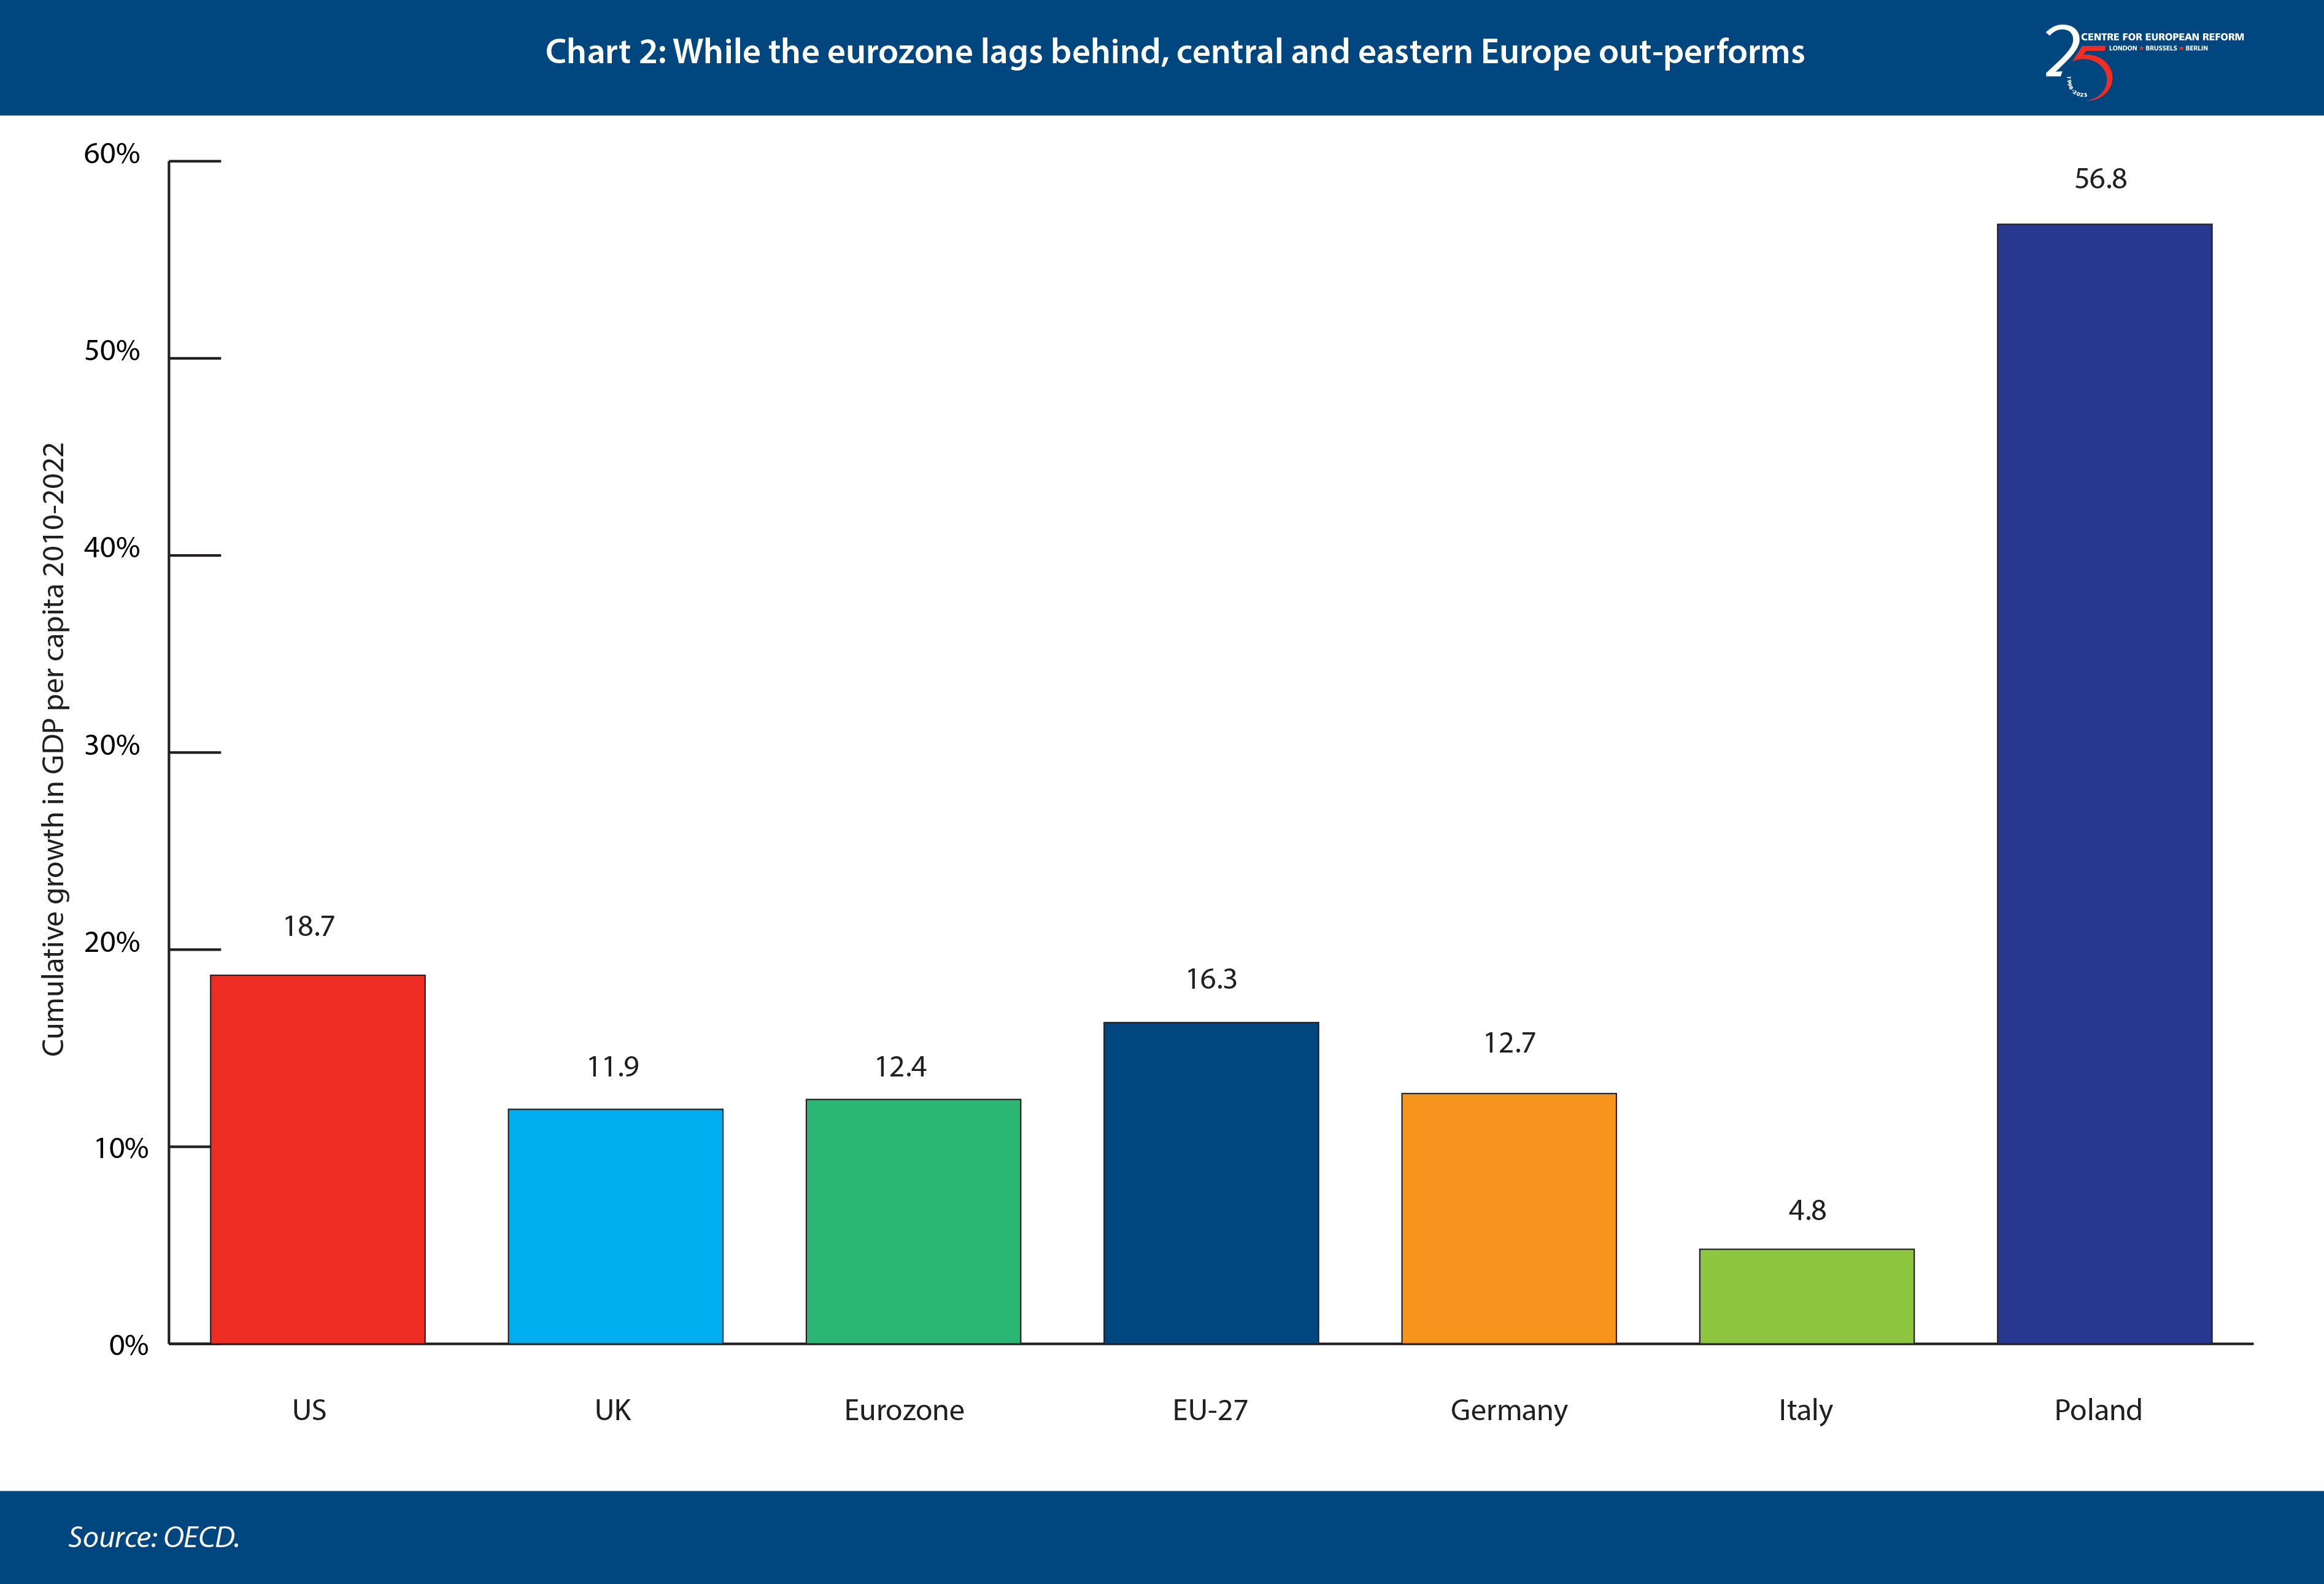
Why then has the US out-performed since 2010? The difference has not been driven by better productivity growth. In fact, as Chart 3 shows, European productivity growth as measured by GDP per hour worked has been faster than in the US, except during the pandemic, when less productive workers were disproportionately laid off in the US, raising measured productivity. The US has grown faster despite relatively modest productivity growth. This holds true, whether you make the comparison with the EU or with the eurozone. Some European countries like Italy (and to a lesser extent the UK) have long-standing problems with productivity growth, but this is not the case for most European countries.
If Europe were being left behind technologically or suffering from an overall lack of investment, we could expect this to be reflected in productivity data, but there is no such trend in the overall figures. Despite concerns about the lack of European tech giants, it is difficult to find support for a lack of adaptability and innovation in European productivity figures. US economic out-performance despite lower productivity growth means that US workers must have worked more hours than European ones.
More Americans have been working, and for longer hours
The EU has produced 16 million new jobs since 2010 according to the OECD, compared to 19 million in the US. This represents an increase of 13.8 per cent in the US, compared to 8.5 per cent in Europe. The US benefited from greater supply of labour due to much higher population growth, but Europe has been able to compensate in part by increasing its employment rate. More than half of the 8 percentage point difference in growth between the US and EU can be attributed to a faster expansion of the US workforce.
Not only has the number of people employed expanded much faster, the evolution of hours worked per employee also differs dramatically on the two sides of the Atlantic. Hours worked per employee remained stable in the US while declining across Europe, except in the UK and the Netherlands. Total hours worked per employee in the EU declined by almost 4 per cent between 2010 and 2022. This is a continuation of a long-term trend: increased employment rates in Europe are largely driven by an increased number of part-time workers, particularly women.
At the same time, Europe has a higher ‘age dependency ratio’, defined as the population younger than 16 or older than 64 as a share of the working-age population, for two reasons: first, the older population has grown faster in Europe due to long-standing low fertility rates. Second, US fertility rates have fallen from around 2.1 per woman in 2007, which is the replacement level needed for the population to stabilise without immigration, to 1.65 in 2021, closer to the EU level of 1.53. This shift has reduced the share of the young dependent population – also known as children – faster in the US than in the EU.
As recently as 2007, the US and the EU had a similar demographic burden, with the age-dependent population in each being around 49 per cent of the working-age population. However, by 2022 that figure had risen to 57 per cent in the EU and 54 in the US. This apparently small difference means that each worker in the EU would have to increase output by almost 2 per cent more to keep per capita GDP at the same level as in the US, assuming all other factors remain the same.
The result is a relative demographic dividend in favour of the US, which is set to remain a factor as Europe continues to age faster, while the US continues to benefit from the higher birth rates it has had in the recent past. Each worker in Europe has a larger dependent population to support and the demographic burden is increasing faster in Europe than in the US. While lower fertility rates in the US in the very long run will lead to a similar situation as in Europe, the slowness of demographic change means that the United States will continue to benefit from more favourable demographics for the coming decades.
There are not many options to alleviate this demographic pressure in the short term, beyond the politically sensitive solution of allowing more immigration from outside to EU to meet increasing labour shortages across the continent. Other ways to address this problem include measures to increase labour force participation and in the long run, family policies like more free childcare that encourage people to have children.
We have seen that higher growth in the US has been enabled by a larger increase in the workforce and more favourable demographics. But it is not enough to have a more abundant supply of labour, there also needs to be sufficient demand for it. And the US has had two sources of demand growth that Europe does not: cheaper energy and more government spending.
The US energy advantage
The US has extensive shale oil and gas reserves, which had been inaccessible until recently, but the shale oil revolution radically changed the global energy landscape from 2010. US production of both natural gas and crude oil has more than doubled in just over a decade, providing abundant and cheap energy, and turning the US into a net energy exporter. In 2010, the US had a trade deficit in energy worth $360 billion, which by 2022 had turned into a surplus of $65 billion. Using a back-of-the-envelope calculation, that change in the trade balance alone boosted US GDP by 1.8 per cent, even before accounting for the effects of increased employment and investment in the oil sector, and lower US electricity prices due to abundant natural gas. US production of shale gas and oil is likely to continue to grow for the next decade and is responsible for nearly all the net global increase in oil production in the past one. US production also benefits Europe to some degree: Europe has relied on US natural gas to help fill the gap left by falling imports from Russia and global prices are lower than they would have been if the US had not been able to increase production.
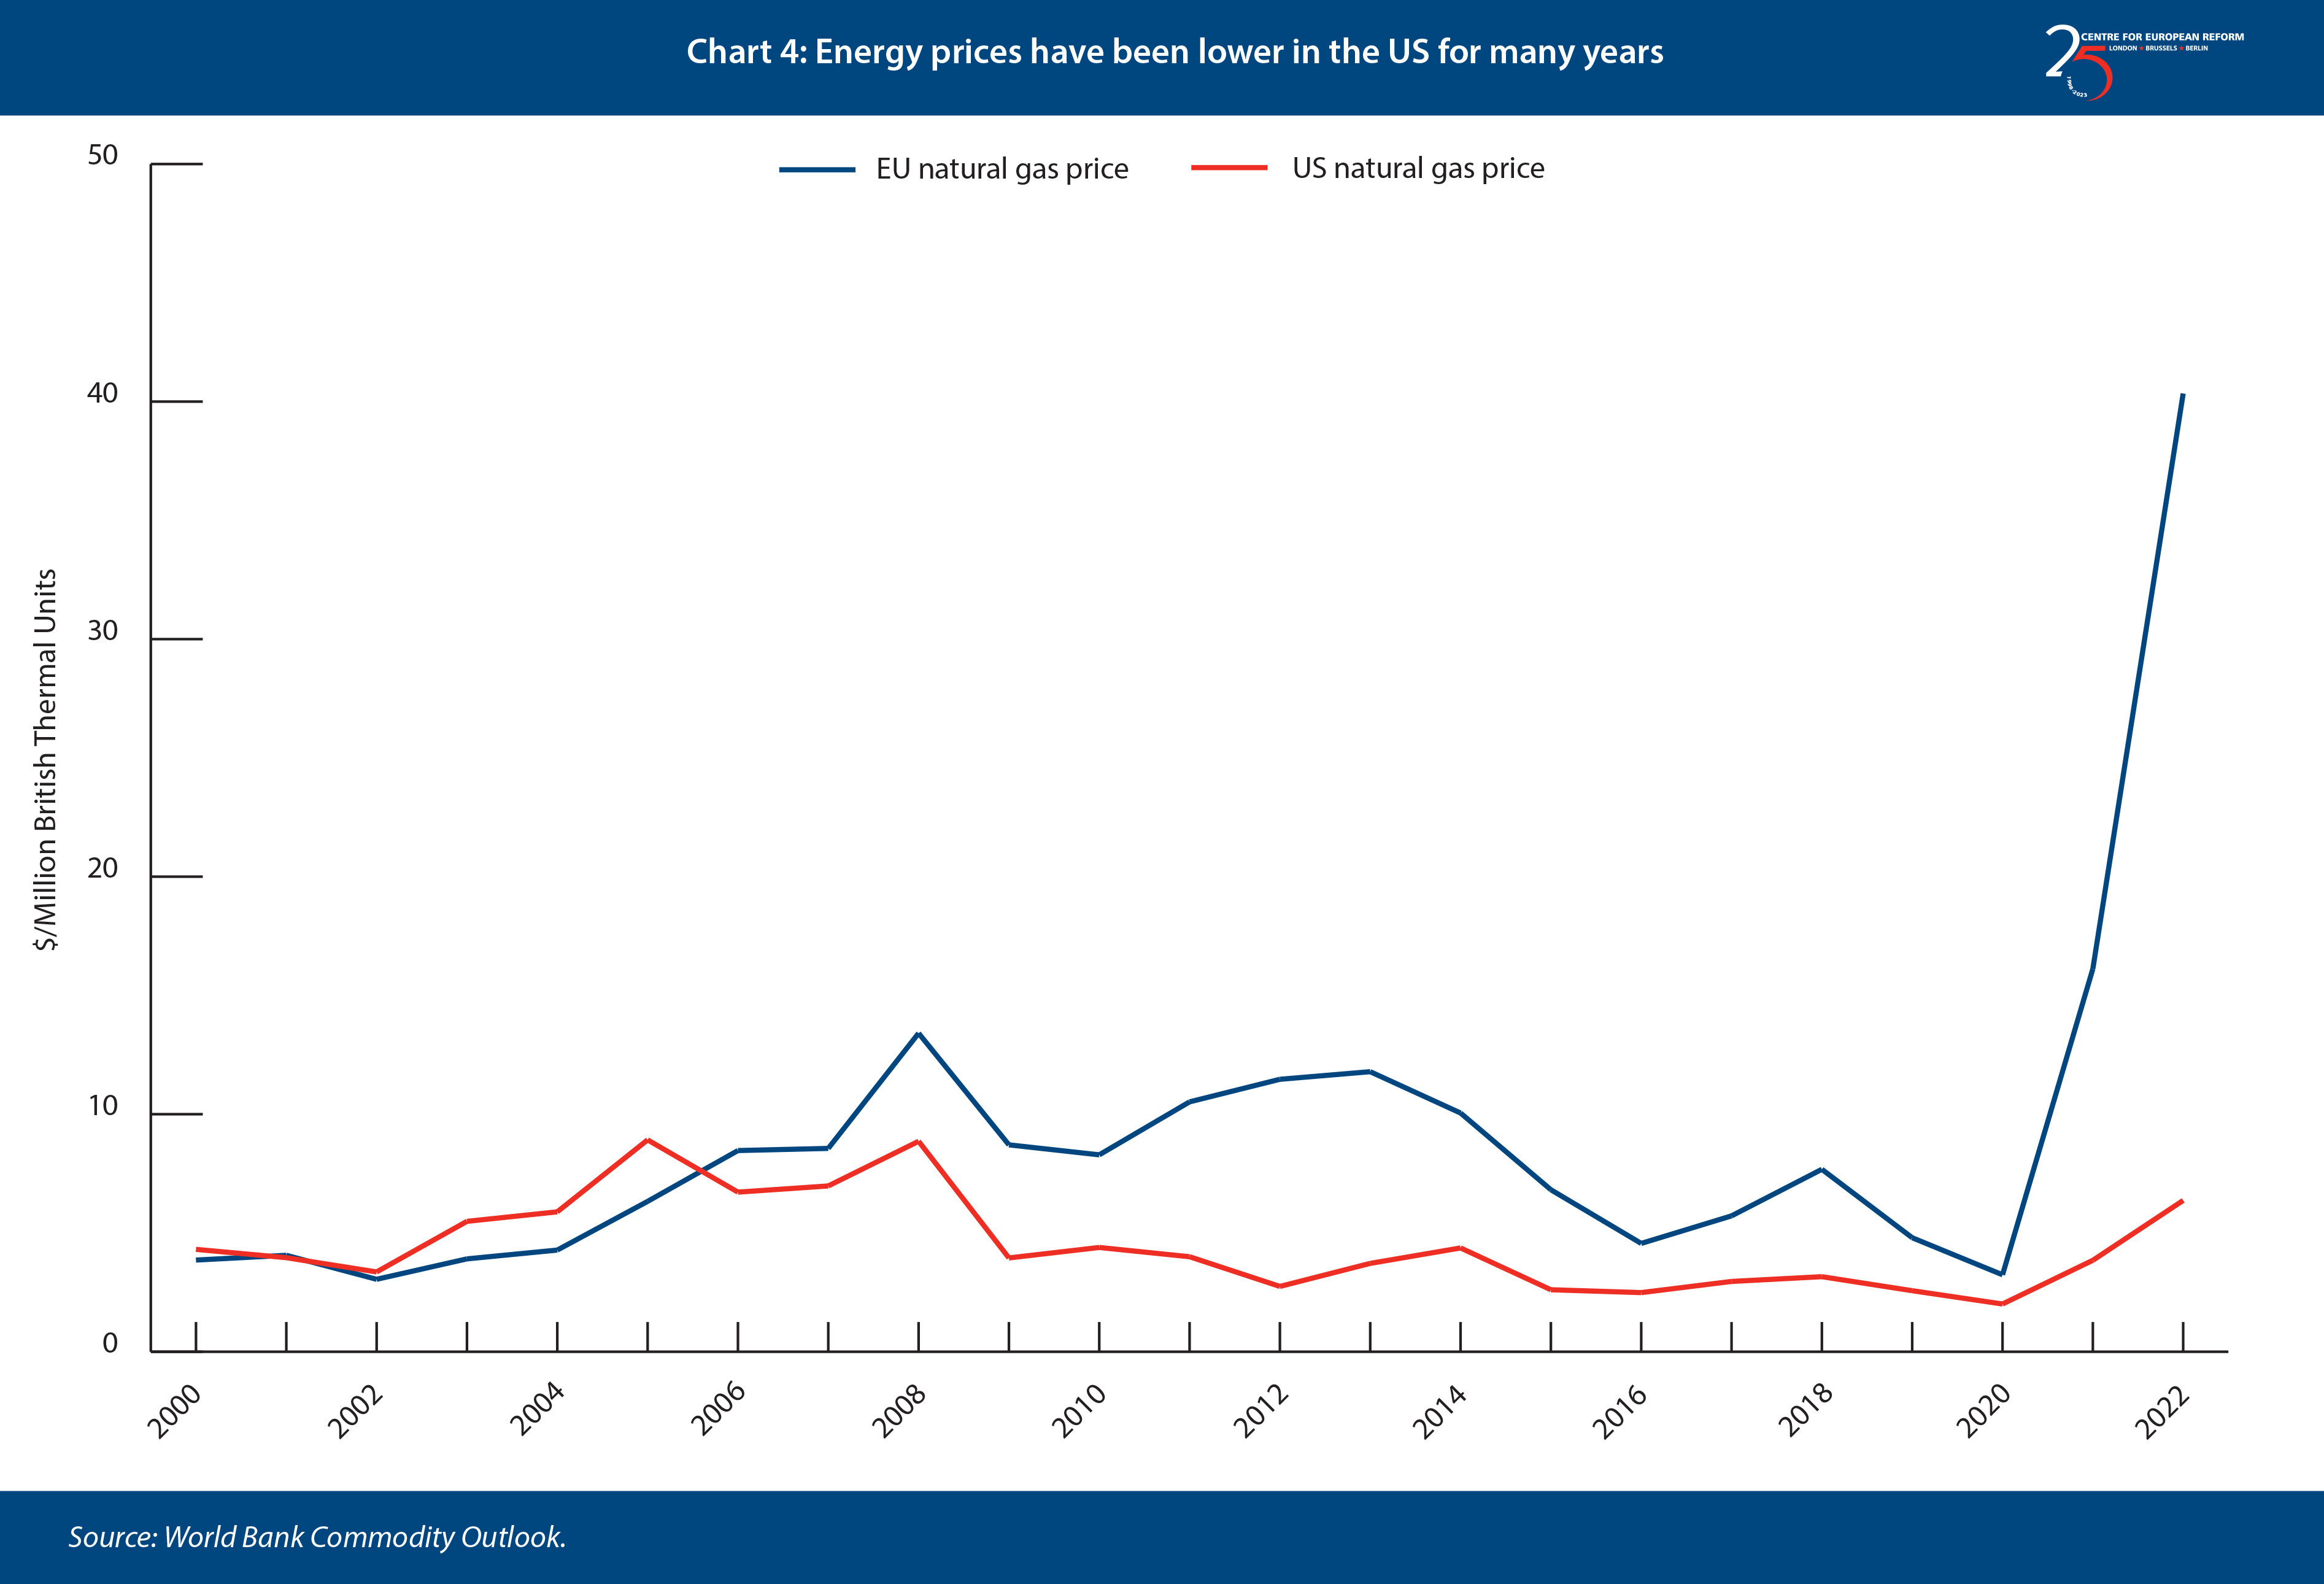
Europe’s domestic natural gas production, meanwhile, has been declining. This has made it more dependent on imports of fossil fuels, leading it first to rely on Russian imports, and then on expensive liquefied natural gas (LNG) after Russia’s invasion of Ukraine. However, even before the recent energy crisis, natural gas was already more expensive in Europe than in the US, while before the development of shale resources they were at a similar level (Chart 4).
There are limited options to change this situation in the short term. Domestic EU and UK production of natural gas is set to continue to decline, reliable suppliers are already producing as much as they can, there are no large undeveloped resources, and the EU has invested in rapidly increasing its import capacity. Natural gas in Europe is likely to remain relatively expensive in the near term, because the only short-term option is relying on LNG imports, which are inherently more expensive than piped gas.
The comparative high cost of energy in Europe and resulting lack of growth can therefore only be resolved through the development of alternative cost-competitive non-fossil energy, such as renewable and nuclear energy. A shift to other energy sources would also improve Europe’s competitiveness as it represents a shift from fossil fuel sources, which put Europe at a disadvantage since they need to be imported at great expense, to energy sources where Europe can participate on a level playing field.
Fiscal stimulus
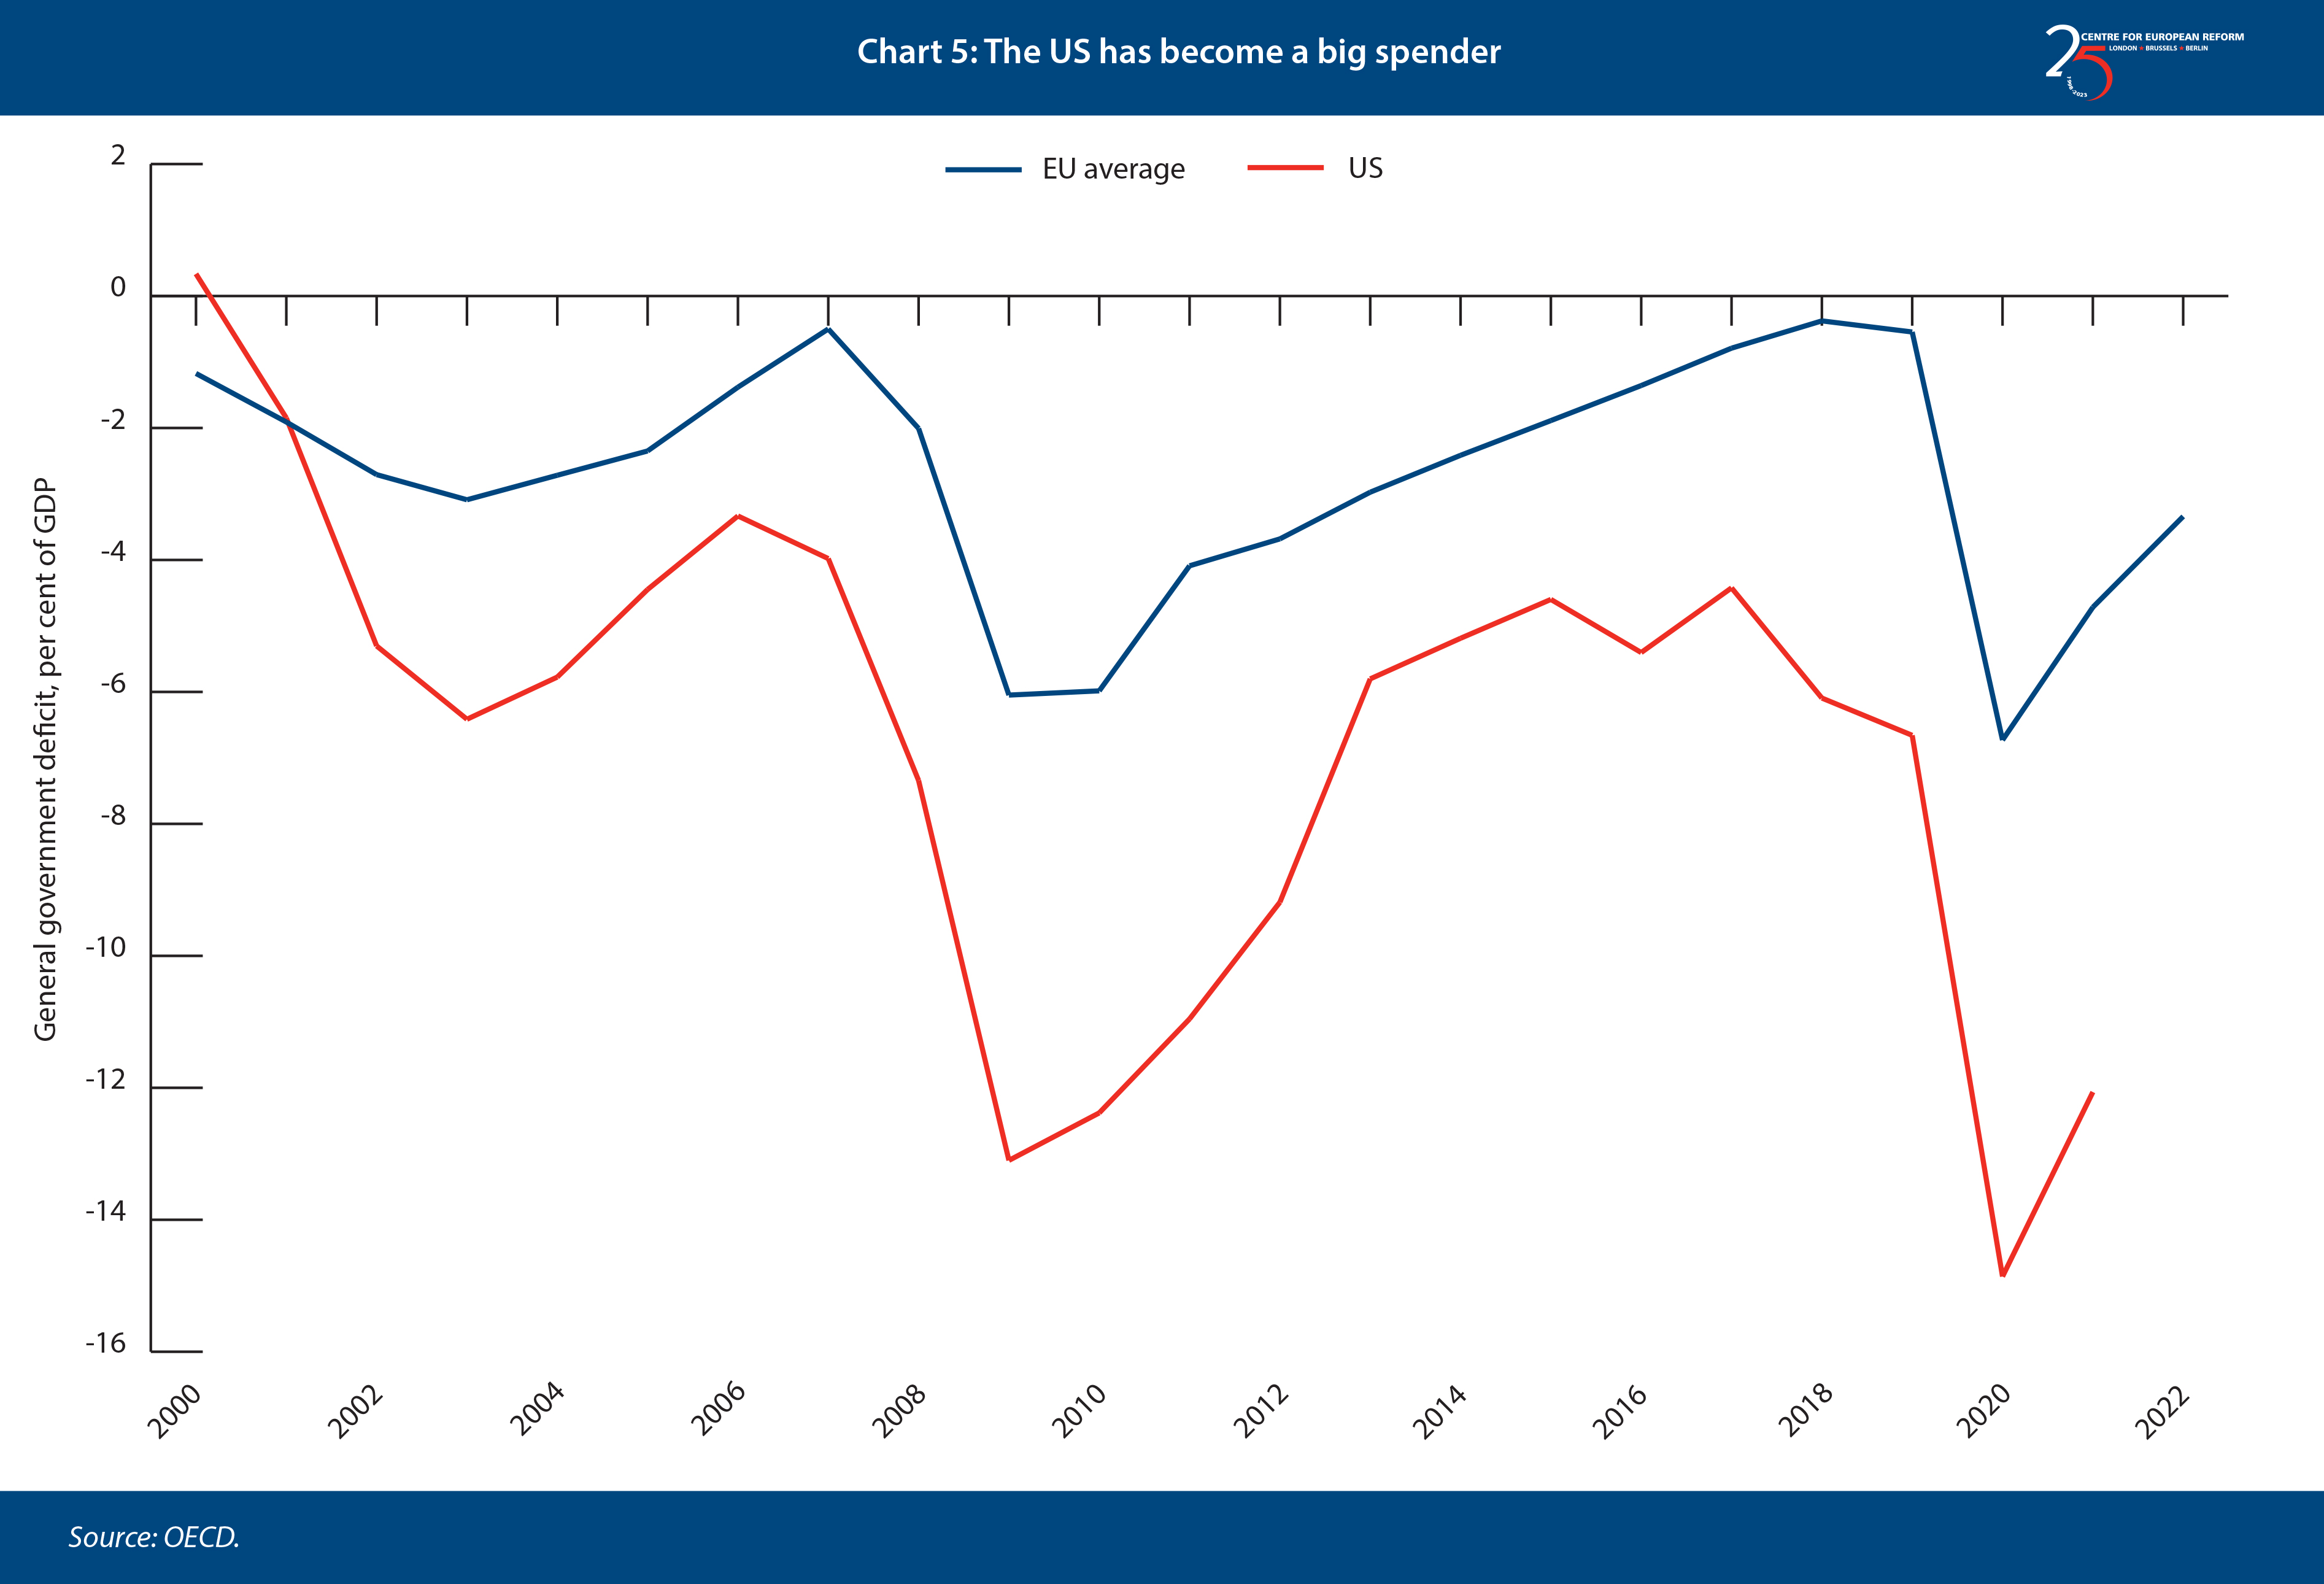
Last, but not least, the US has for the last 20 years consistently run a much more aggressive fiscal policy than governments in Europe, with larger deficits in normal times and significantly larger responses to both the GFC and Covid. After the GFC – and even during the eurozone crisis, which started in 2010 – European countries reduced their budget deficits, sharply curtailing growth, particularly in 2010-13. Meanwhile, in the US the general government deficit stabilised under Obama’s second term and then started growing again under Trump. Thus, by 2019 European countries were on average close to a balanced budget while the US ran a deficit of more than 6 per cent of GDP. Following the Covid crisis, the US unleashed a much larger stimulus package, combined with a series of expensive spending programmes such as the CHIPS Act and the Inflation Reduction Act.
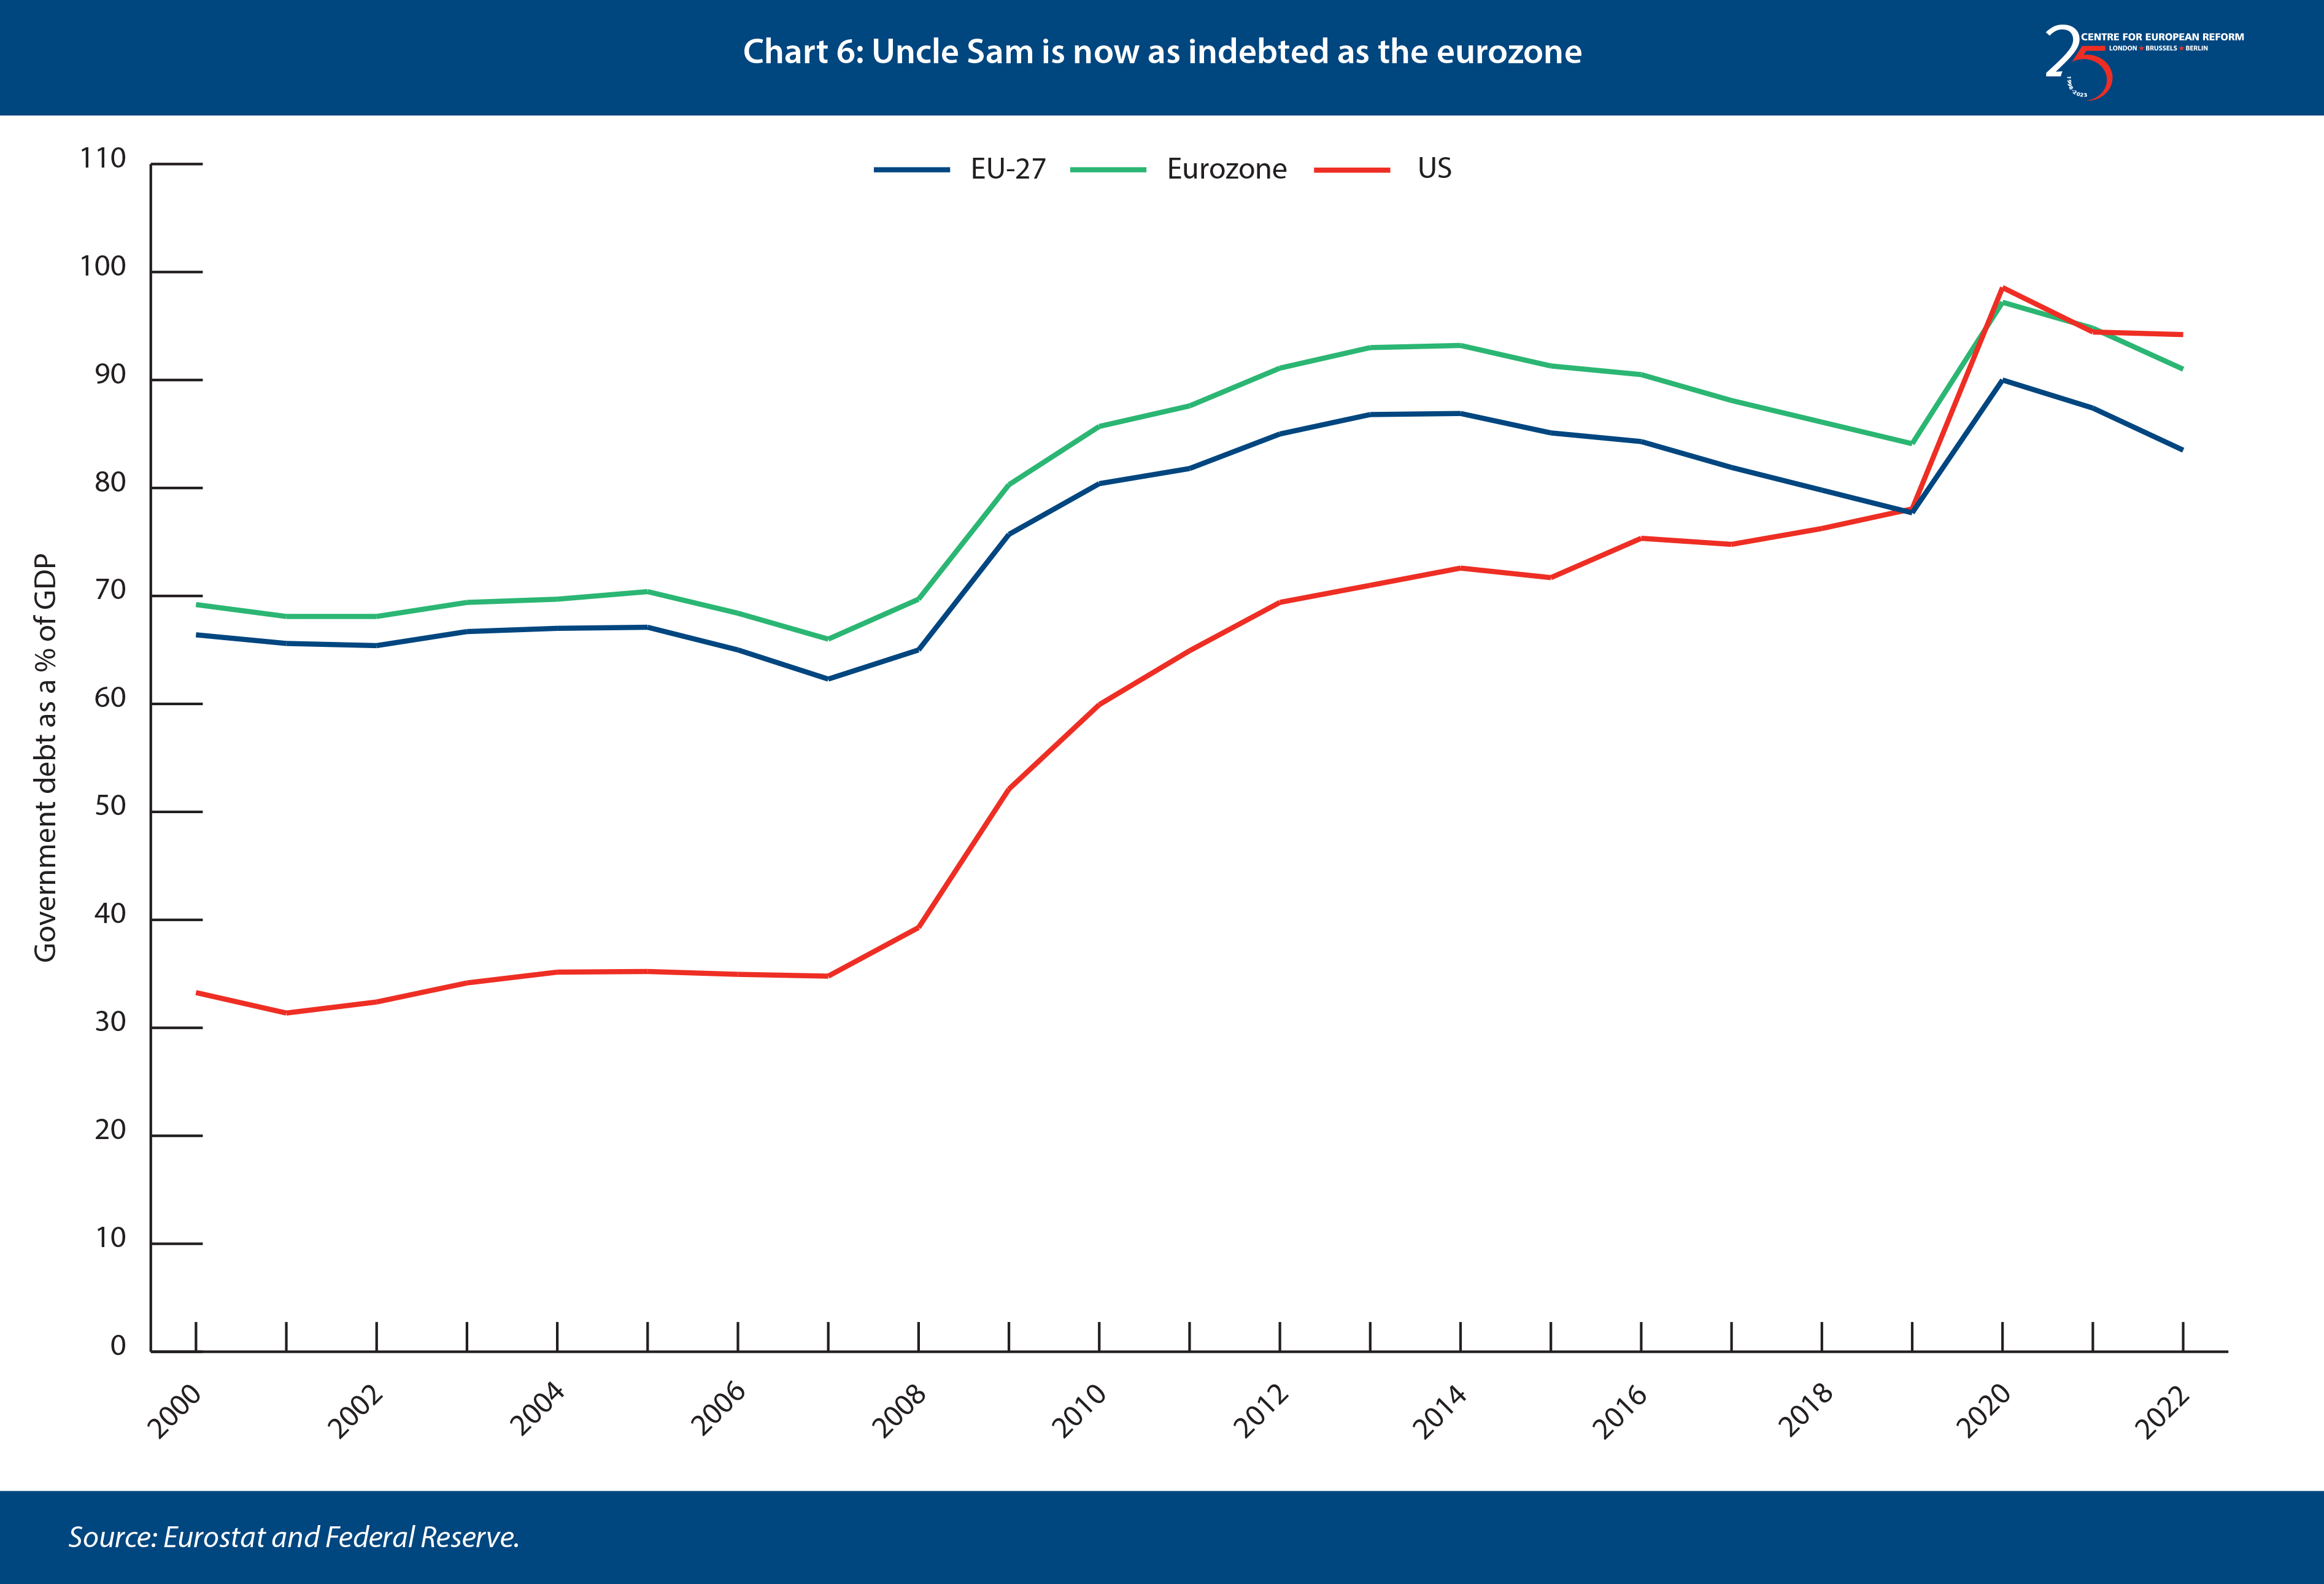
There are several reasons why the US fiscal path has diverged so heavily from Europe’s. First, the constraints and rules of the eurozone are designed to reign in deficit spending, even at the expense of growth. Second, the US entered the 21st century under President Bill Clinton with a very low debt-to-GDP ratio and a budget surplus. Third, the US has been willing to use this fiscal space over time and now has a similar debt level to the eurozone. Further fiscal expansion seems implausible at this point. The US ran a federal deficit of 7.5 per cent of GDP in its 2023 fiscal year, ending on September 30th, even though growth was quite high, unemployment low and interest rates significantly higher than in the past. Even on current spending plans fiscal policy will detract from growth in the US in the next few years, and any fiscal consolidation efforts would aggravate that. Fiscal policy in the US may look a lot more like in Europe in the future.
Conclusion
The US has outperformed Europe on economic growth since 2010. Some of this can be explained by self-inflicted wounds and austerity politics in Europe, notably during the eurozone crisis, but there are also clear, structural advantages that the US has benefited from. With a demographic tailwind relative to Europe, an abundant and cheap energy supply, and a looser budget policy, US out-performance should come as no surprise. But the rapid growth in shale oil and gas production is largely over and the US will not be able to run an expansive fiscal policy forever.
European policy-makers can take some consolation in good productivity growth and are already taking steps to address Europe’s energy crisis. In many countries, governments are seeking to raise immigration to tackle demographic problems. But Europe must also avoid repeating the mistakes of the eurozone crisis and austerity era: if new self-inflicted wounds can be avoided Europe need not fret too much about its underperformance vis-a-vis the US.
Aslak Berg is a research fellow at the Centre for European Reform.
Add new comment